
Alan Sampedro
Data Analyst
Solving business problems and supporting better decisions with data 📊
In Desktop, Select "Window Width" For Better View
Instacart Customer Shopping Behavior
Exploring Instacart shopping data to understand sales behavior and identify potential customer profiles for targeted marketing strategies.
2023 FLU SEASON IN THE UNITED STATES
Analyzing flu trends nationwide to guide the placement of extra medical personnel to meet rising healthcare needs.
Post-Pandemic Worldwide Layoffs
Understanding the global landscape of layoffs across industries after the declaration of the COVID-19 Pandemic in 2020 to present day.

Rockbuster Film Rental Analysis
Answering business questions to support the BI department in the development of a new product launch strategy.
Subscription Payment Funnel Analysis
Examining the nuances in household income and the cost of living across different regions throughout the United States.
Call Center Help Desk Performance
Tracking monthly performance of customer service agents and inbound calls for a call center help desk.
Health & Economic Worldwide Dynamics
Investigating the interplay of life expectancy and economic drivers in developed and developing countries worldwide.
Instacart Sales and Customer Behavior
Problem Statement
Identify unique customer profiles within the existing customer base, investigate sales behavior across them, and propose strategies for improved customer segmentation.
Key Questions
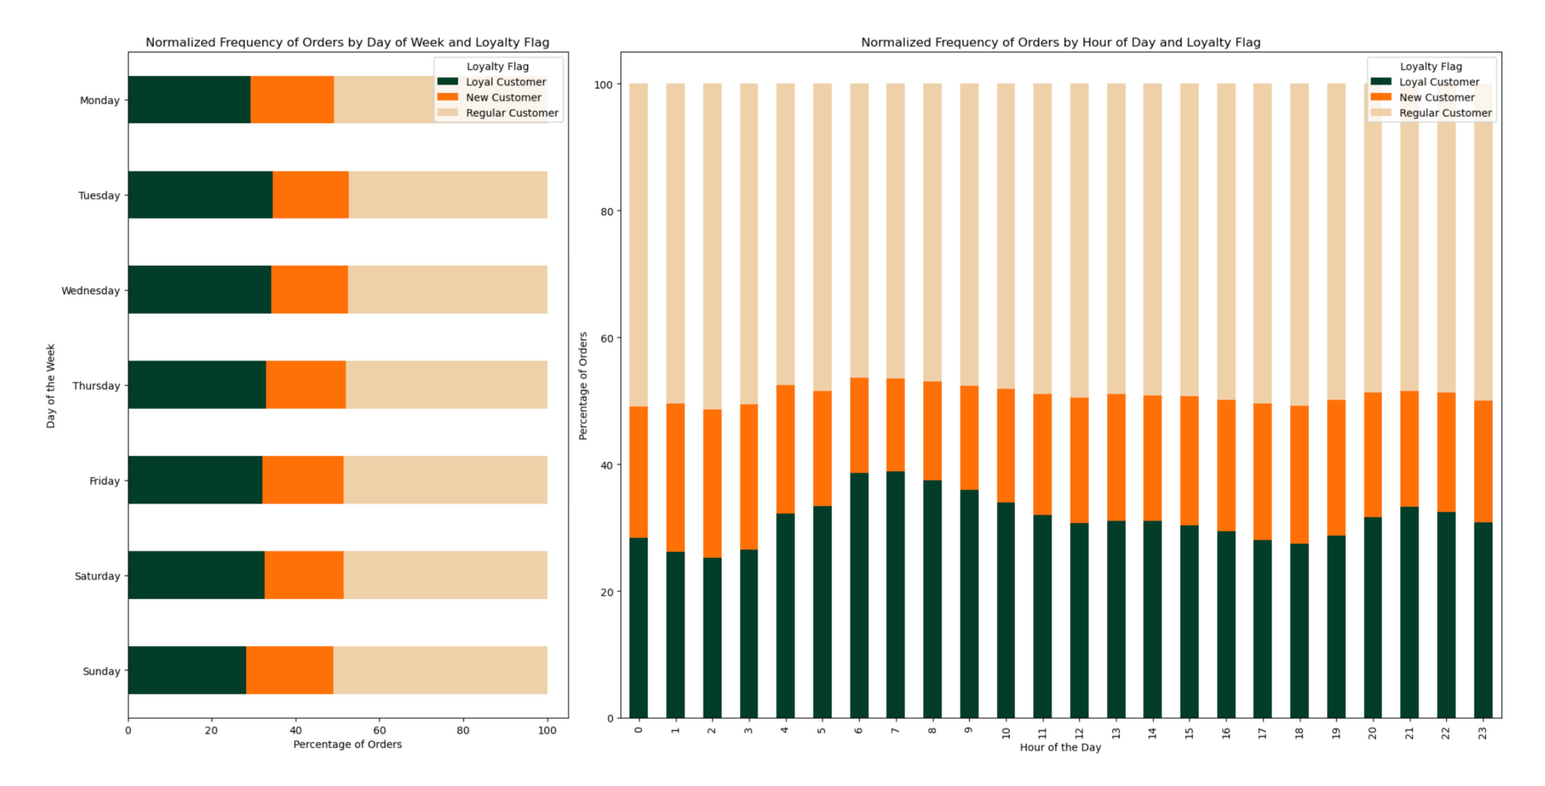
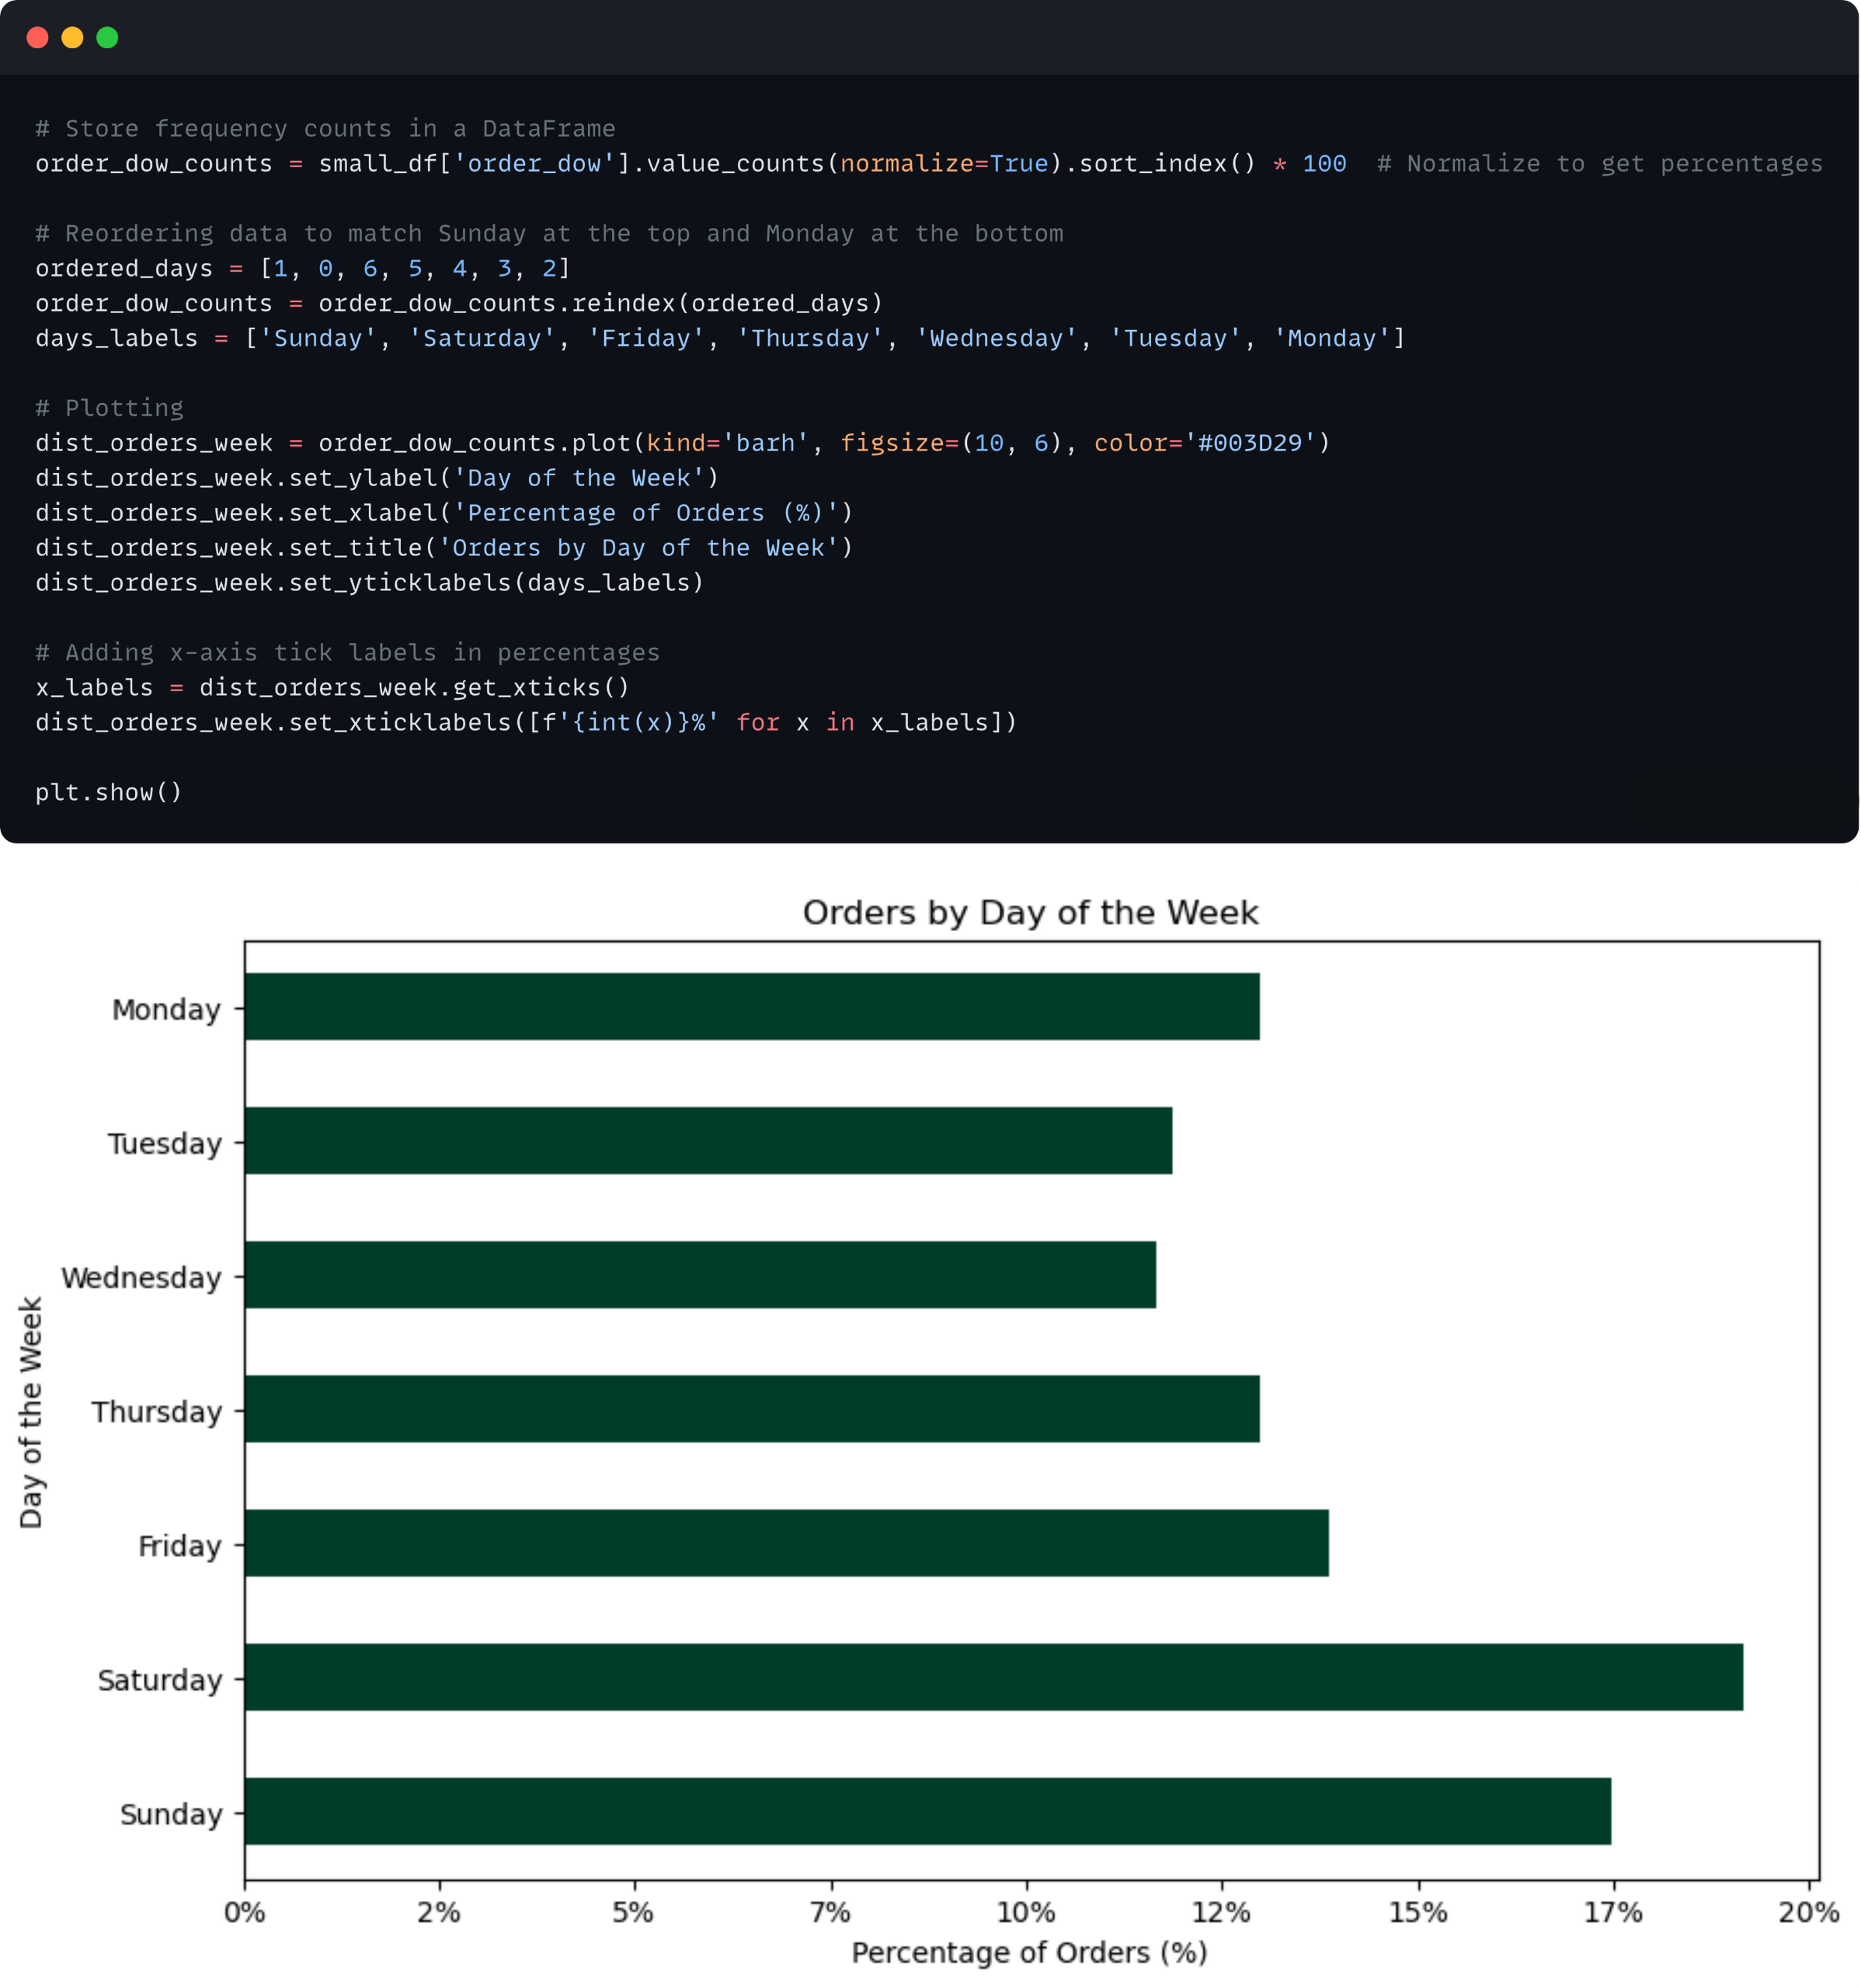
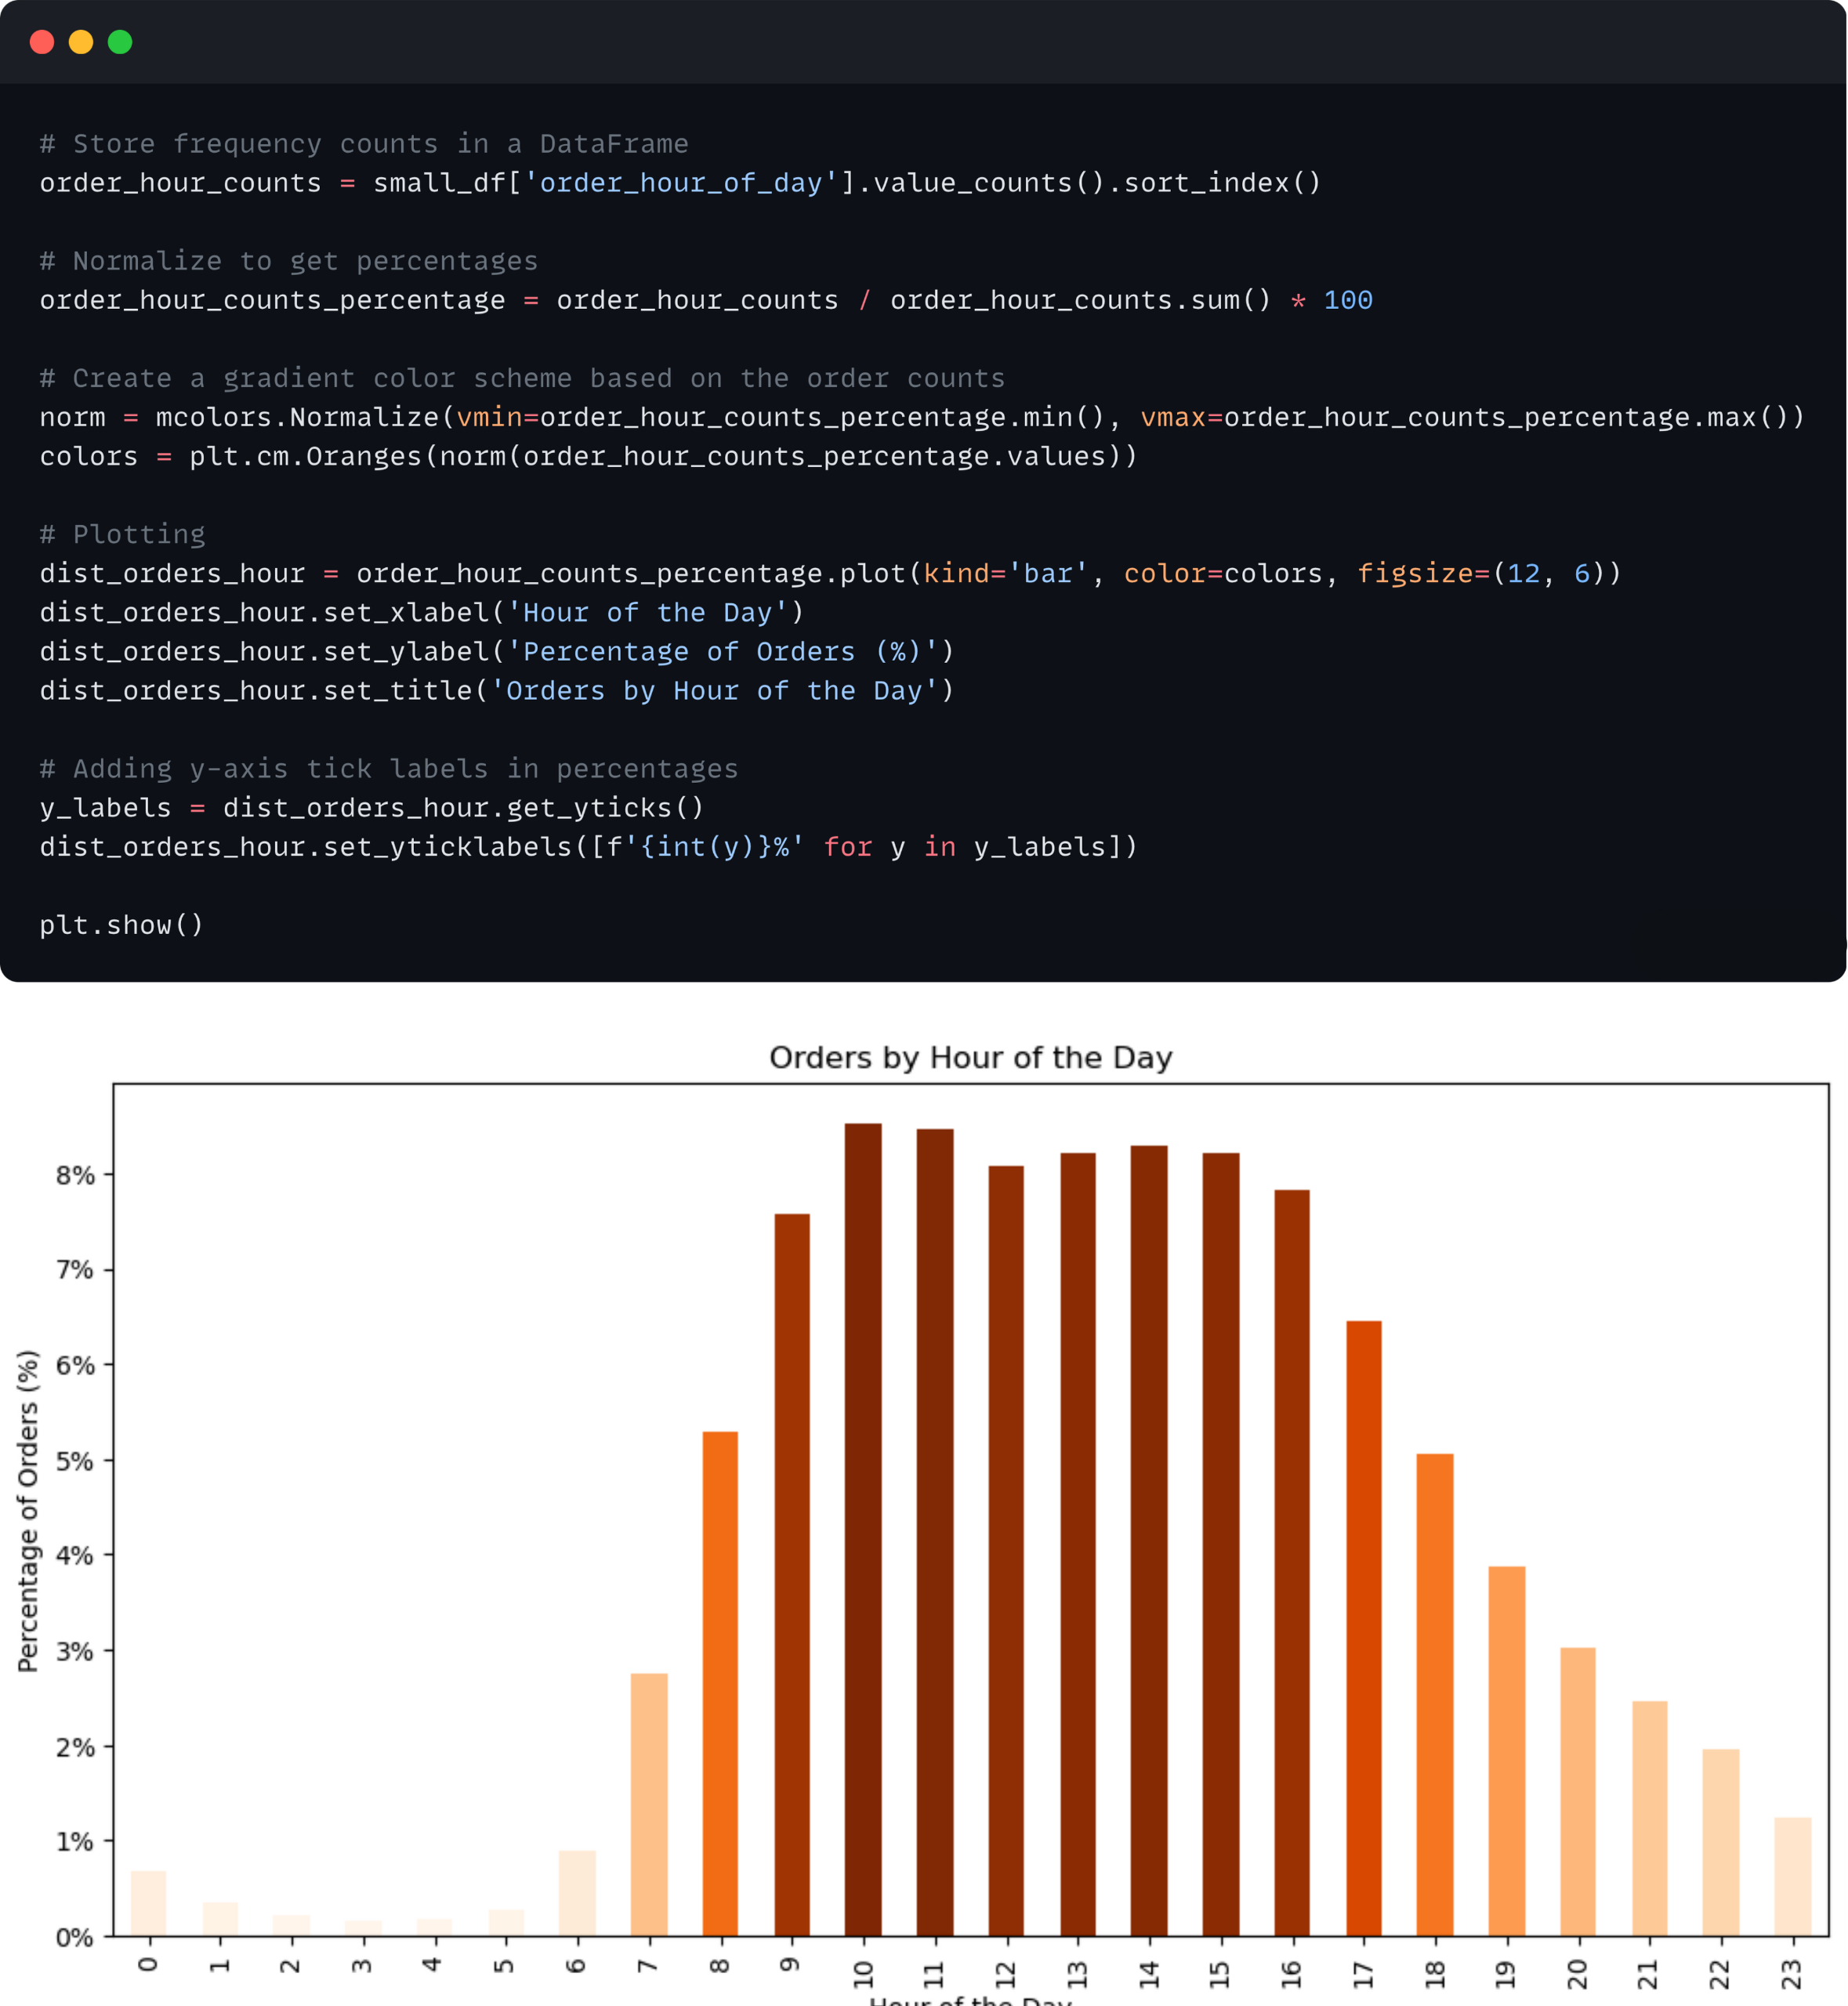
What are the busiest days of the week and hours of the day for orders?
What is the distribution of brand loyalty among customers?
What differences exist in ordering habits among different customer profiles?
Data Preparation
The Instacart Online Grocery Shopping Dataset 2017 was sourced from Instacart and consolidated in Kaggle.
Customers dataset fabricated by CareerFoundry for the purposes of this project.
The data was imported and preprocessed in a Python environment using a Jupyter Notebook, where multiple datasets were joined, and procedures like imputation, standardization, and subsetting were performed.
Data Analysis
Results & Takeaways
Weekends (especially Saturdays) are the busiest days for orders. Peak ordering times are from 10 AM to 4 PM.
The distribution of the volume of orders and total revenue by hour are highly similar, indicating a stable average spending per order throughout the day, with both metrics peaking from 10 AM to 4 PM and dipping during early mornings and late evenings.
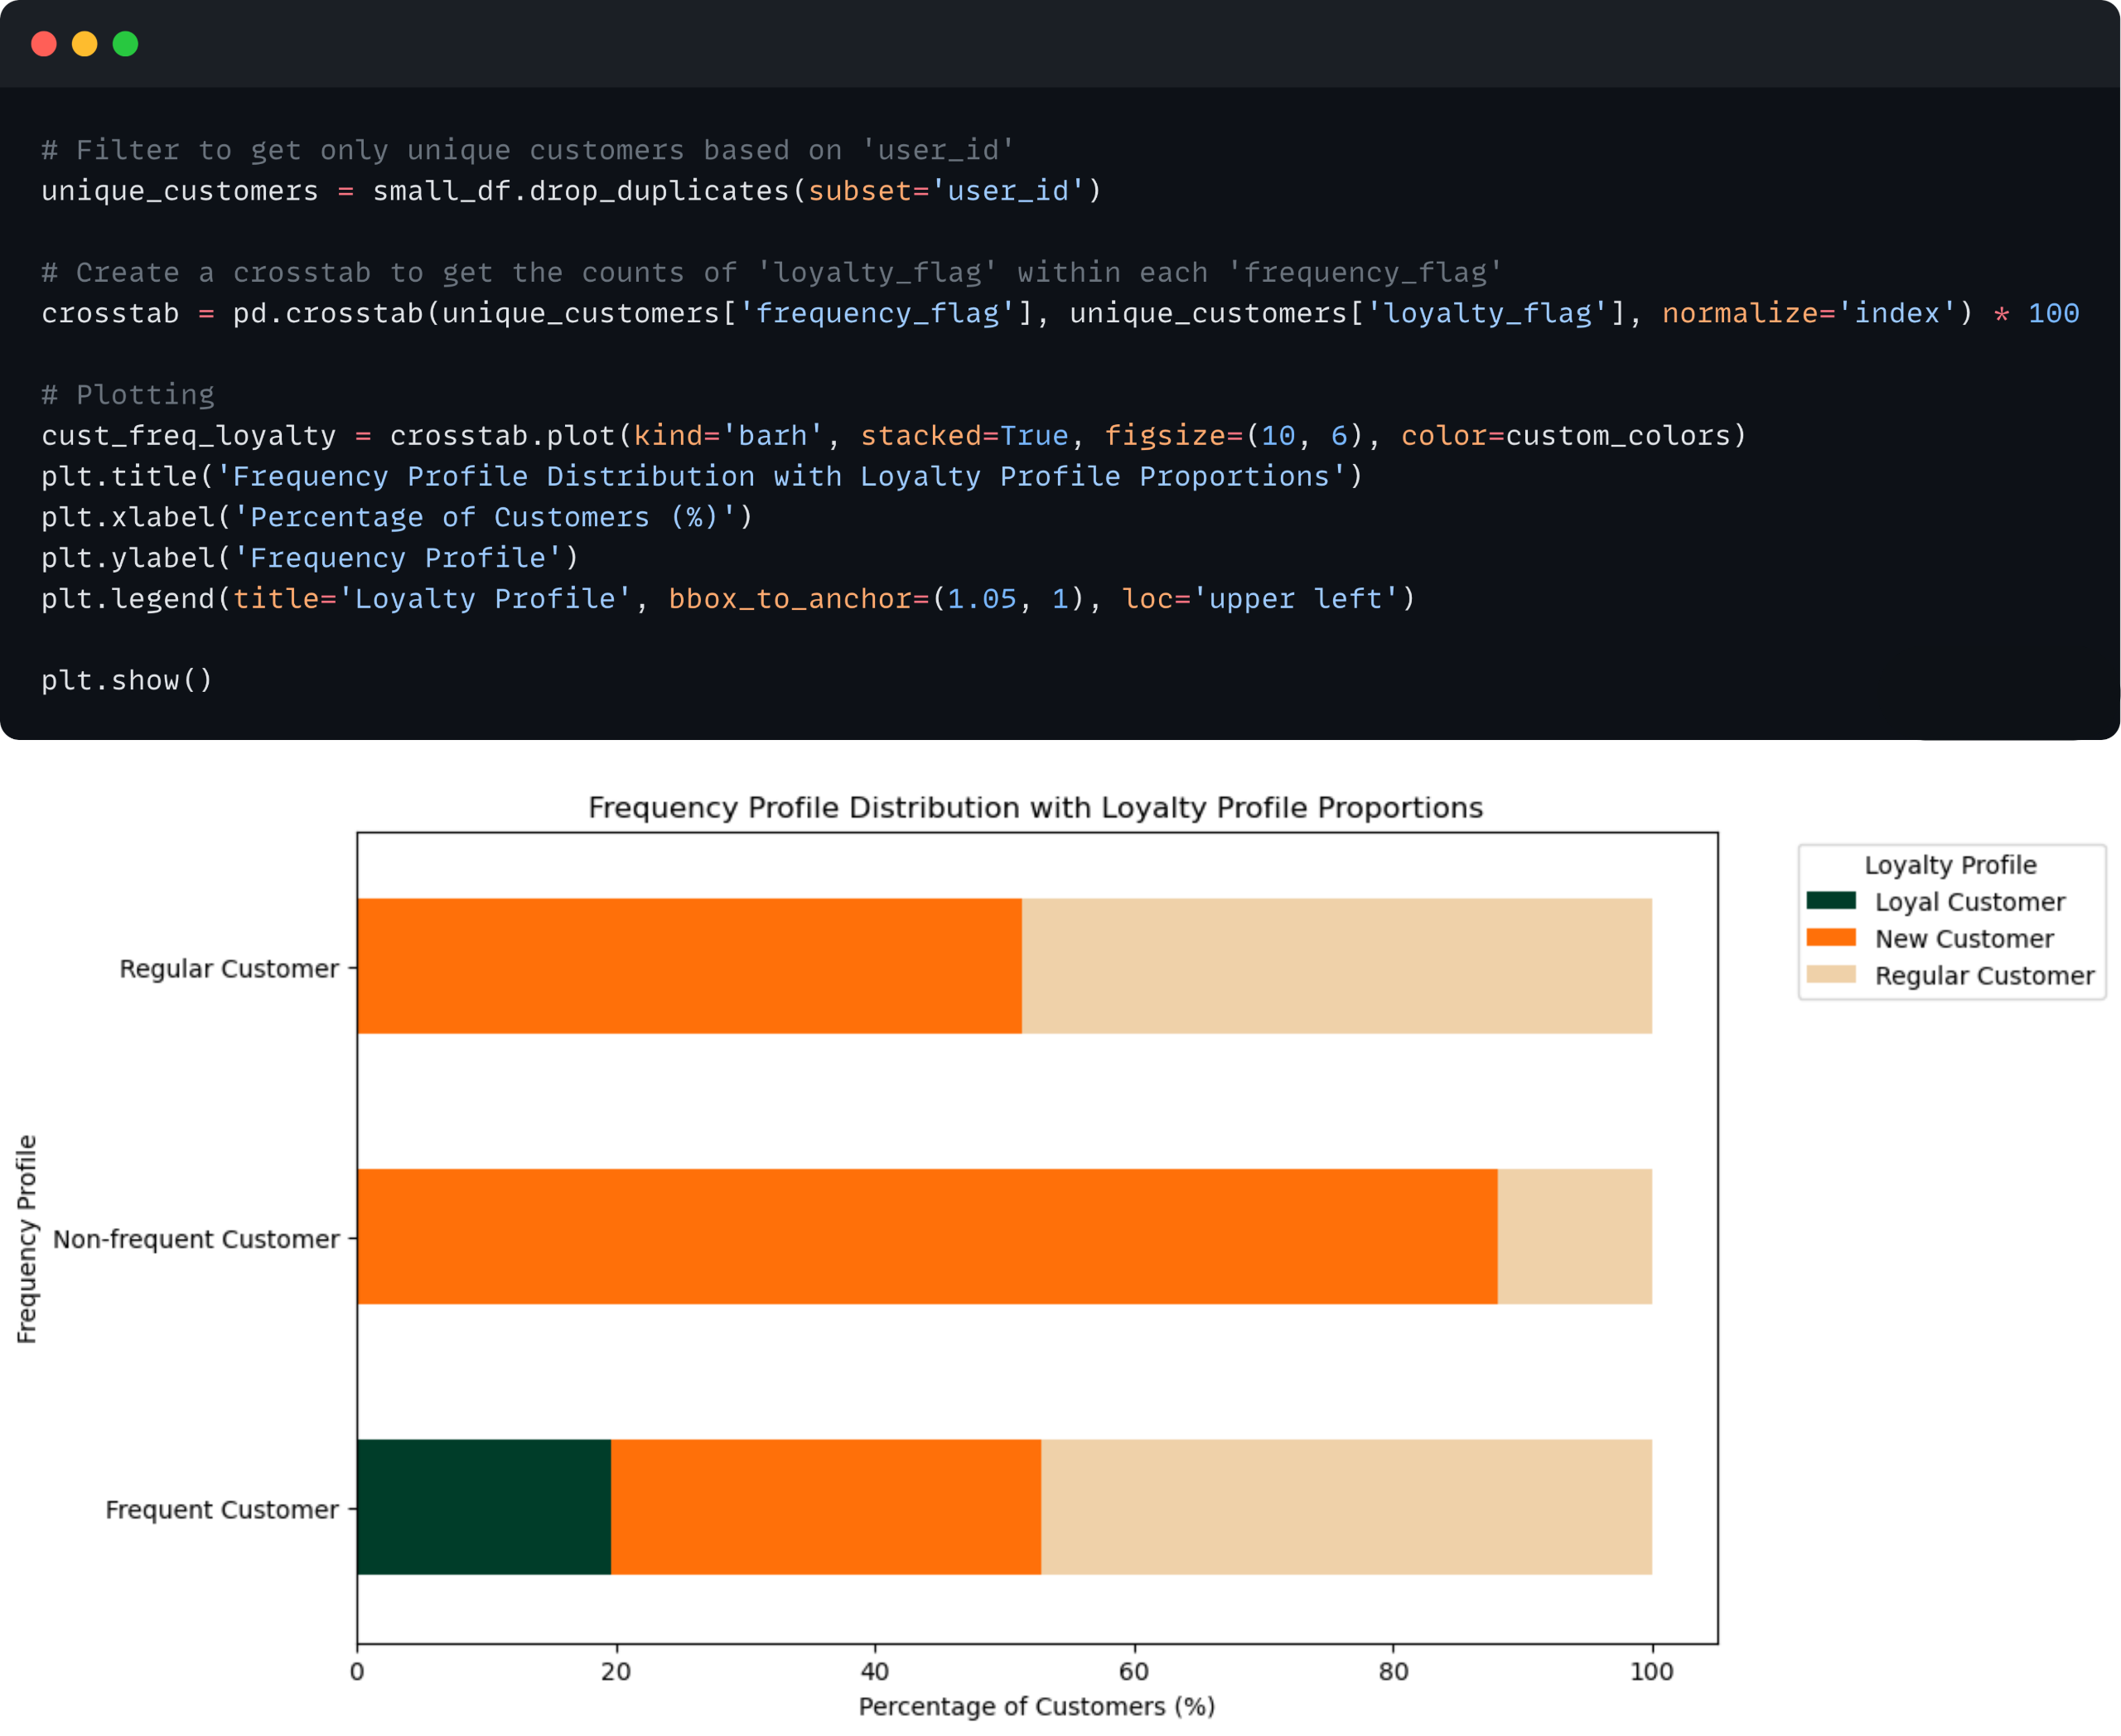
Frequent Customers form the largest segment, predominantly consisting of loyal and regular customers, while non-frequent customers are mainly new and regular customers.
Over half of the customer base consists of new customers, indicating significant potential for converting them into regular or loyal customers through targeted engagement strategies.
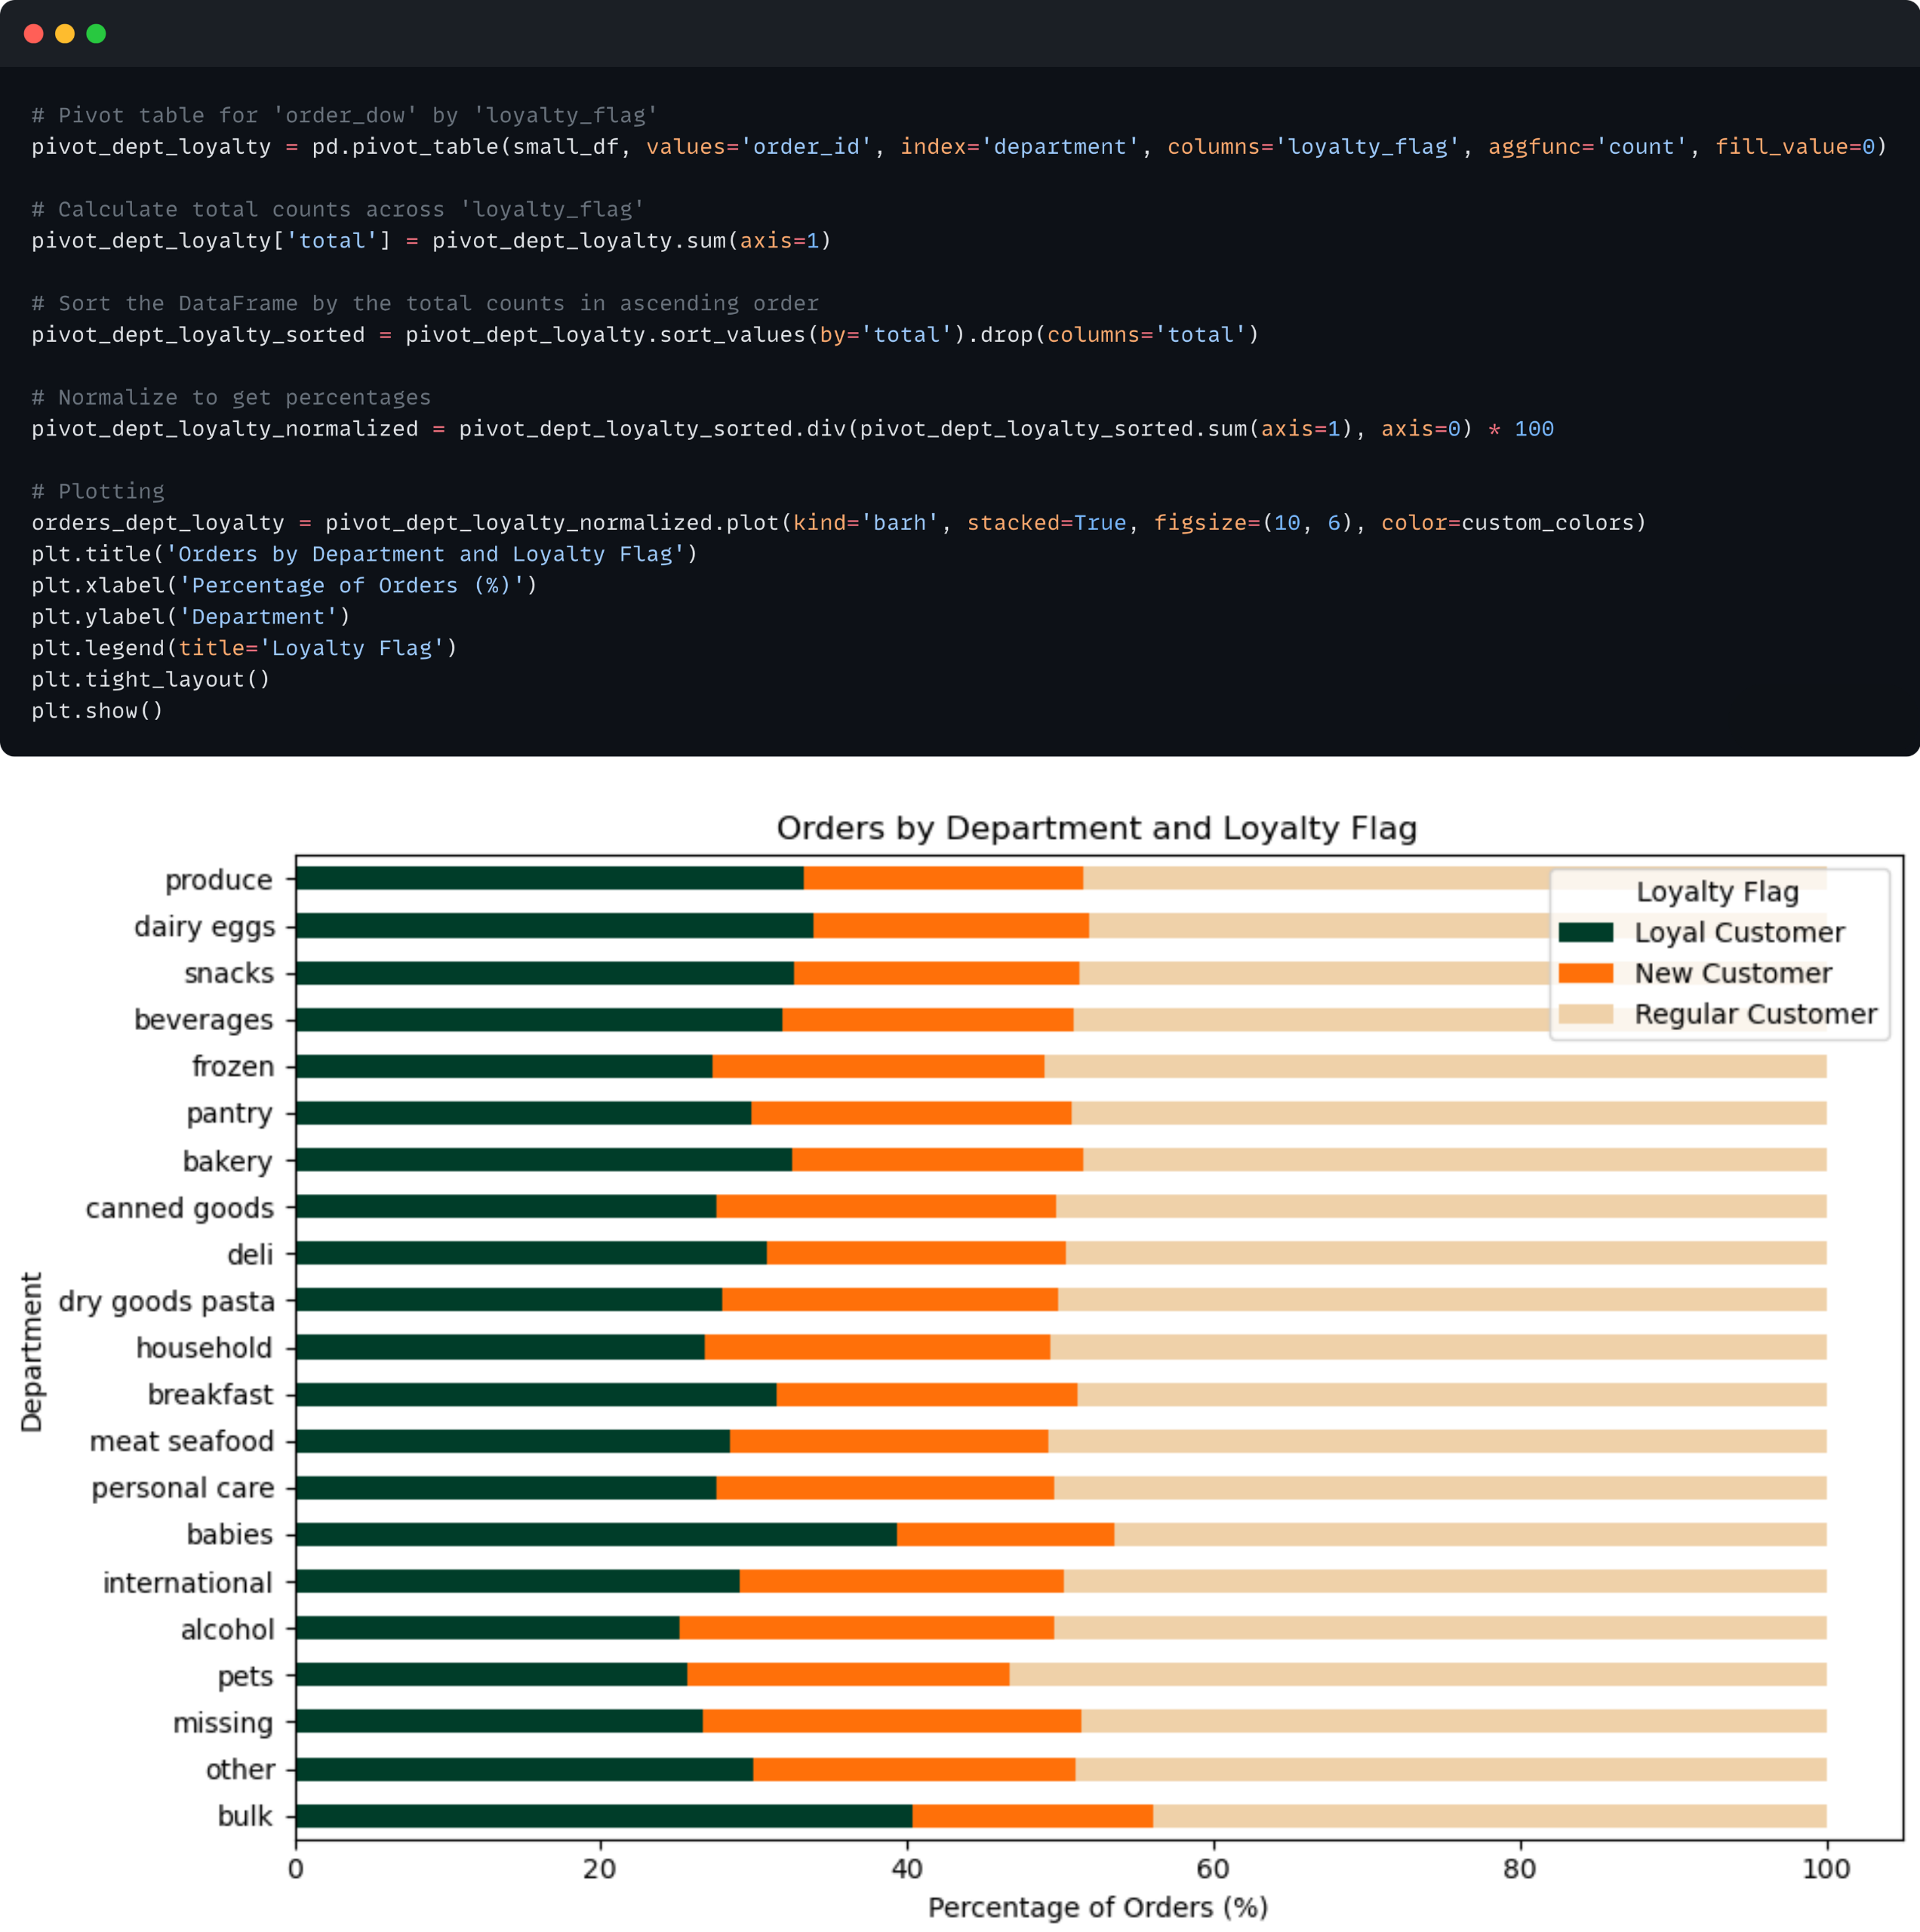
Regular Customers dominate orders across most departments, highlighting their broad engagement with various product categories. Loyal Customers show significant activity in babies and bulk departments, indicating opportunities for targeted marketing strategies for this segment of customers.
Recommendations
To effectively engage key customer segments, tailor marketing campaigns to married individuals and parents, who dominate order volumes. Focus on family-oriented products and promotions, offering bundle deals and discounts on bulk purchases to appeal to their needs. Additionally, create personalized campaigns that resonate with these segments, such as family meal planning tips and home organization hacks.
Capitalize on peak shopping hours (10 AM to 4 PM) by offering special promotions and limited-time offers to new and frequent customers, encouraging higher spending and repeat purchases. Schedule advertisements and promotions during low activity periods (early mornings and late evenings) to drive more traffic during these times. Strengthen customer loyalty programs by rewarding regular and loyal customers with exclusive deals and personalized recommendations based on past purchases.
Develop region-specific marketing strategies, with a focus on the West and South regions, which show the highest order volumes. Create campaigns that cater to local preferences and popular product categories, such as beverages and pantry items in the West, and canned goods and bakery products in the South. By leveraging data insights to refine customer segmentation and personalize marketing efforts, the company can boost sales and enhance customer loyalty across all regions and departments.
Rockbuster Film Rental Analysis
Problem Statement
Answer business questions to provide support to the Business Intelligence (BI) department in developing an effective launch strategy for the upcoming online video service.
Key Questions
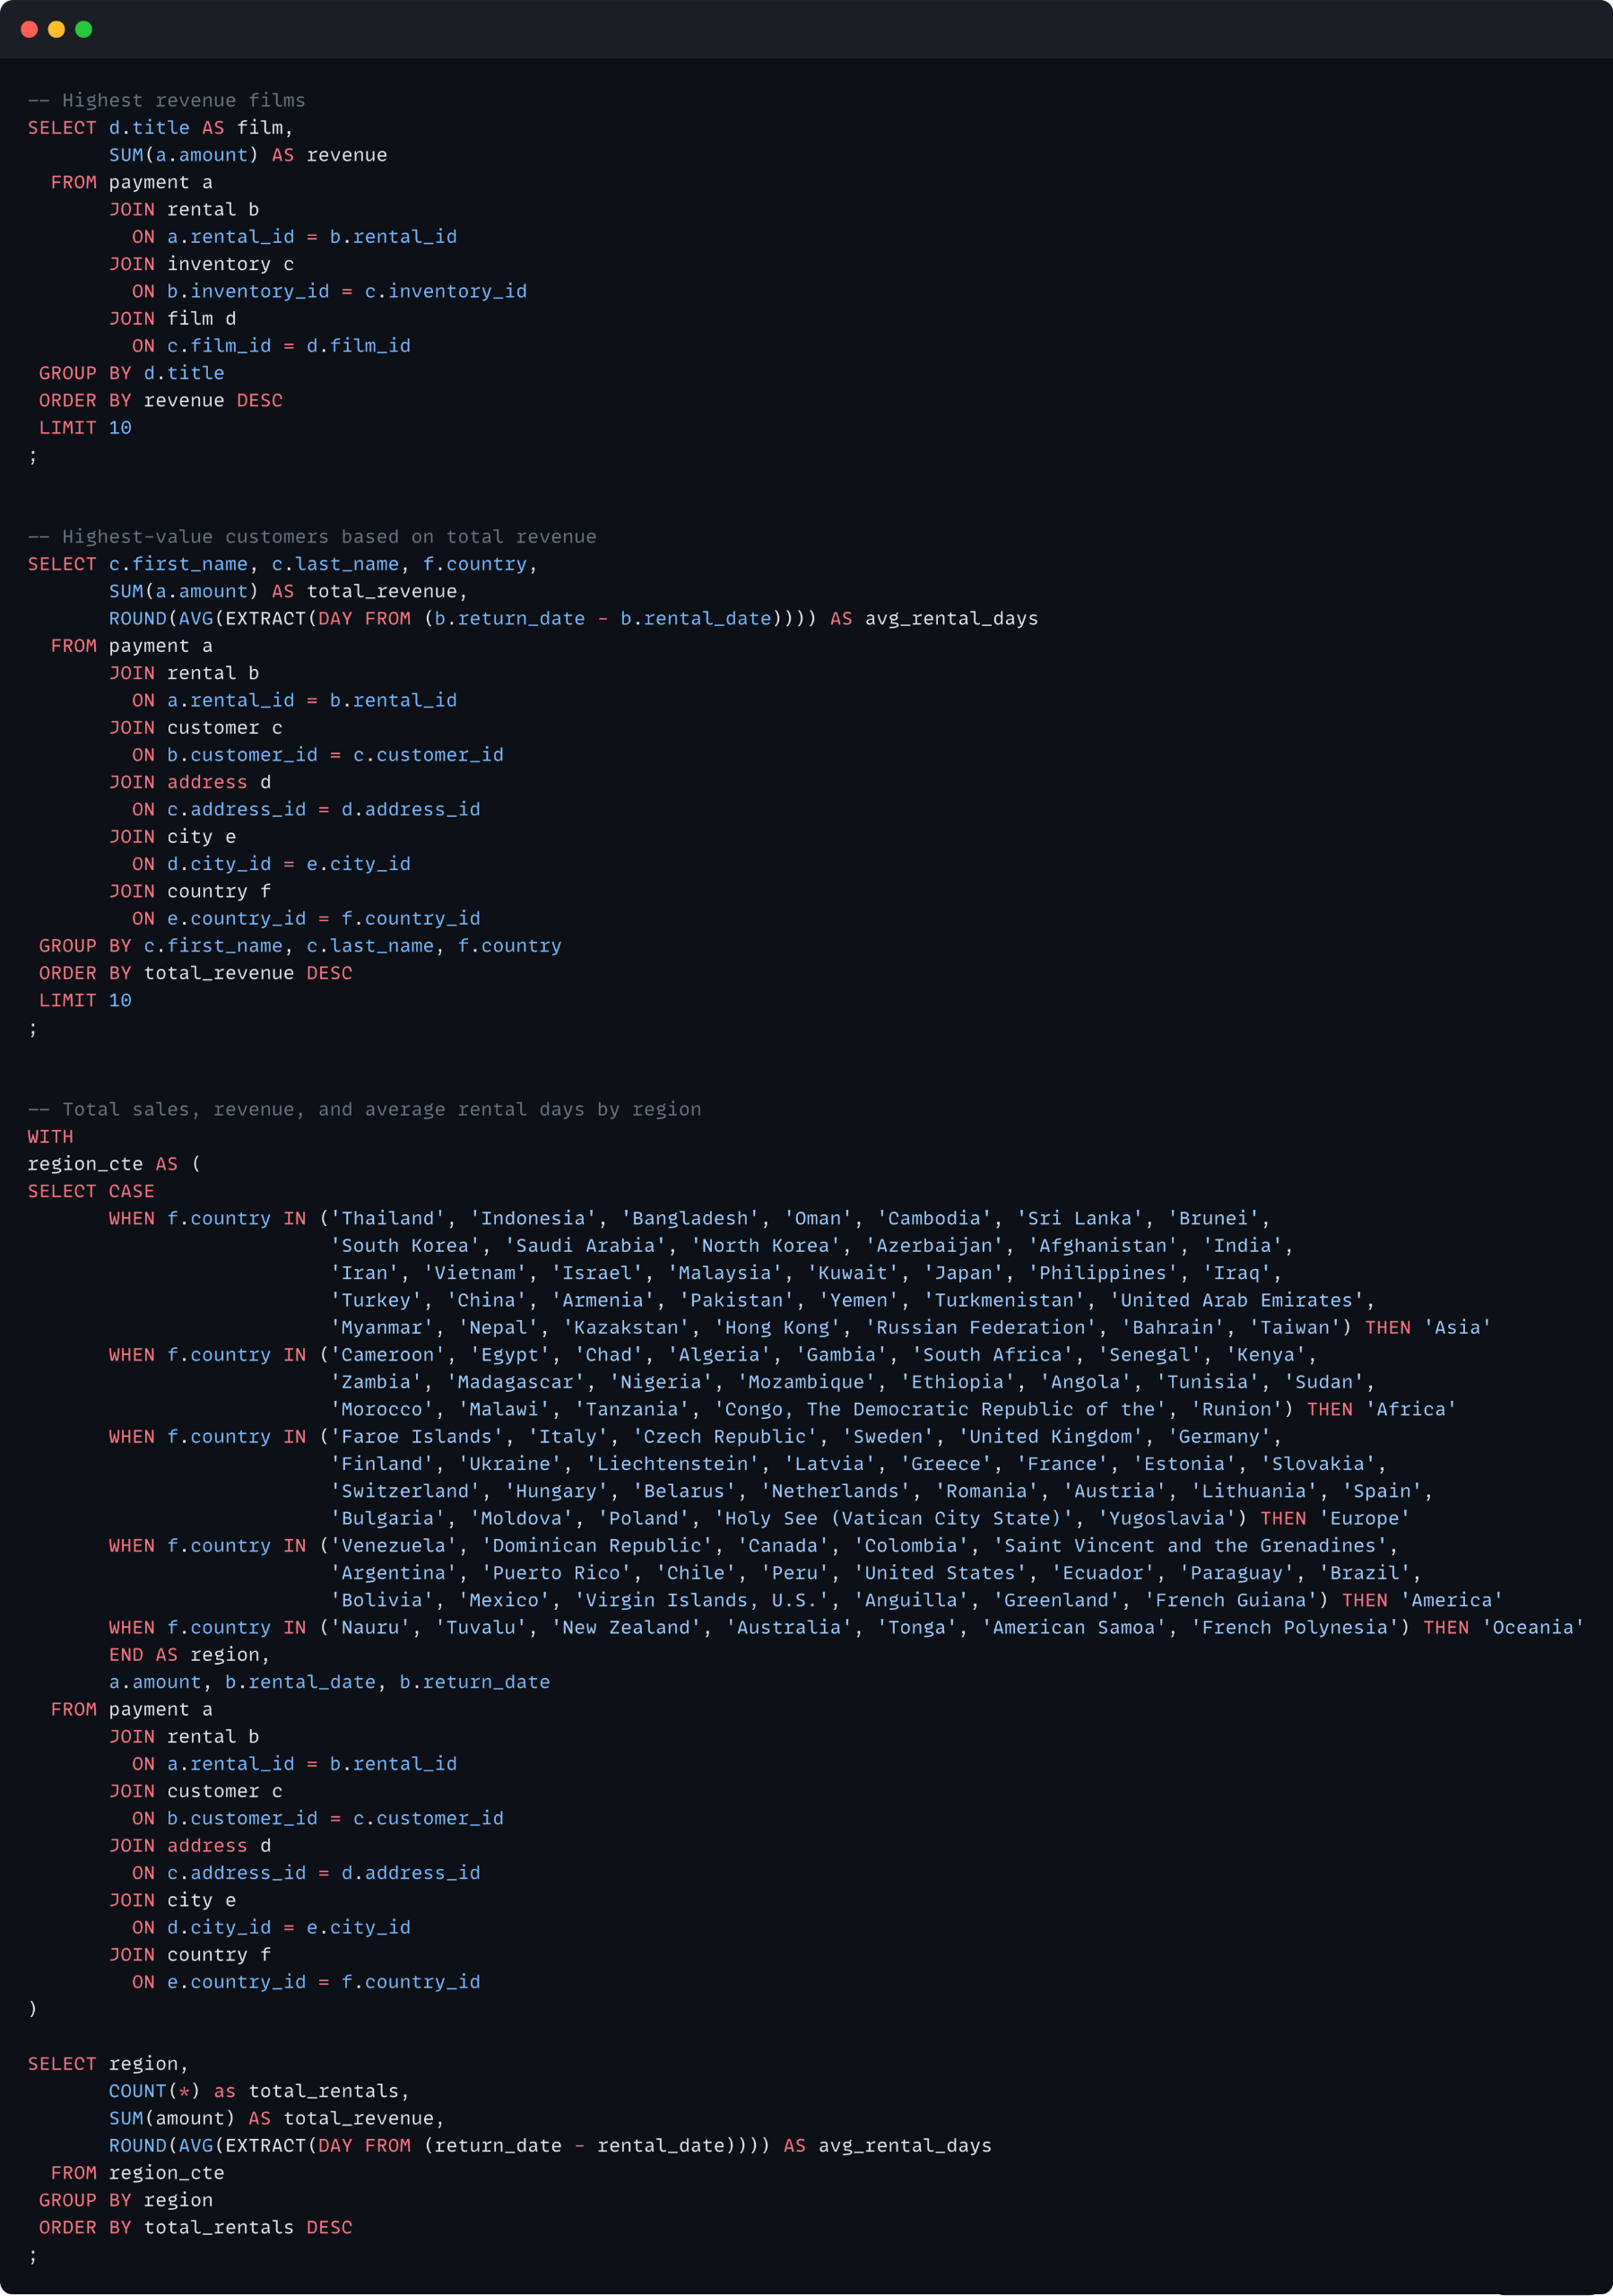
Which movies contributed the most/least to revenue gain?
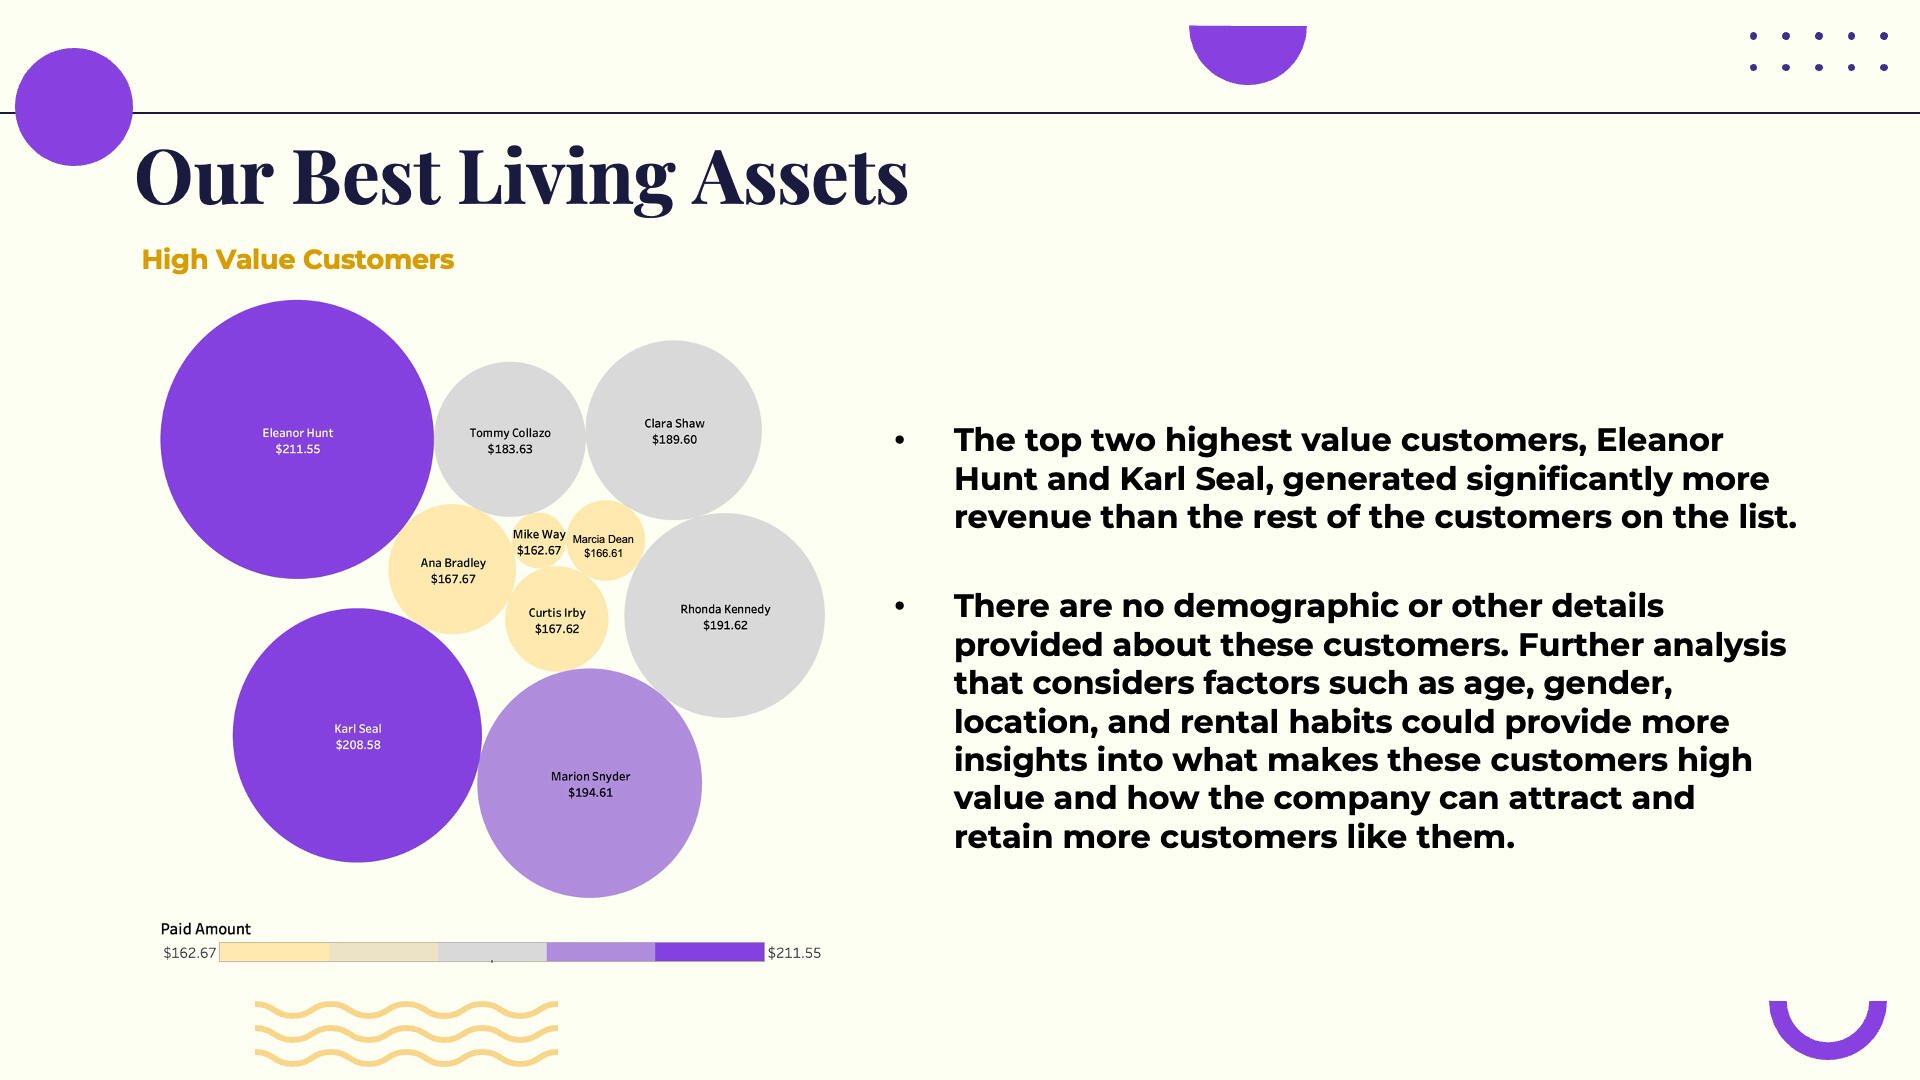
Where are customers with a high lifetime value based?
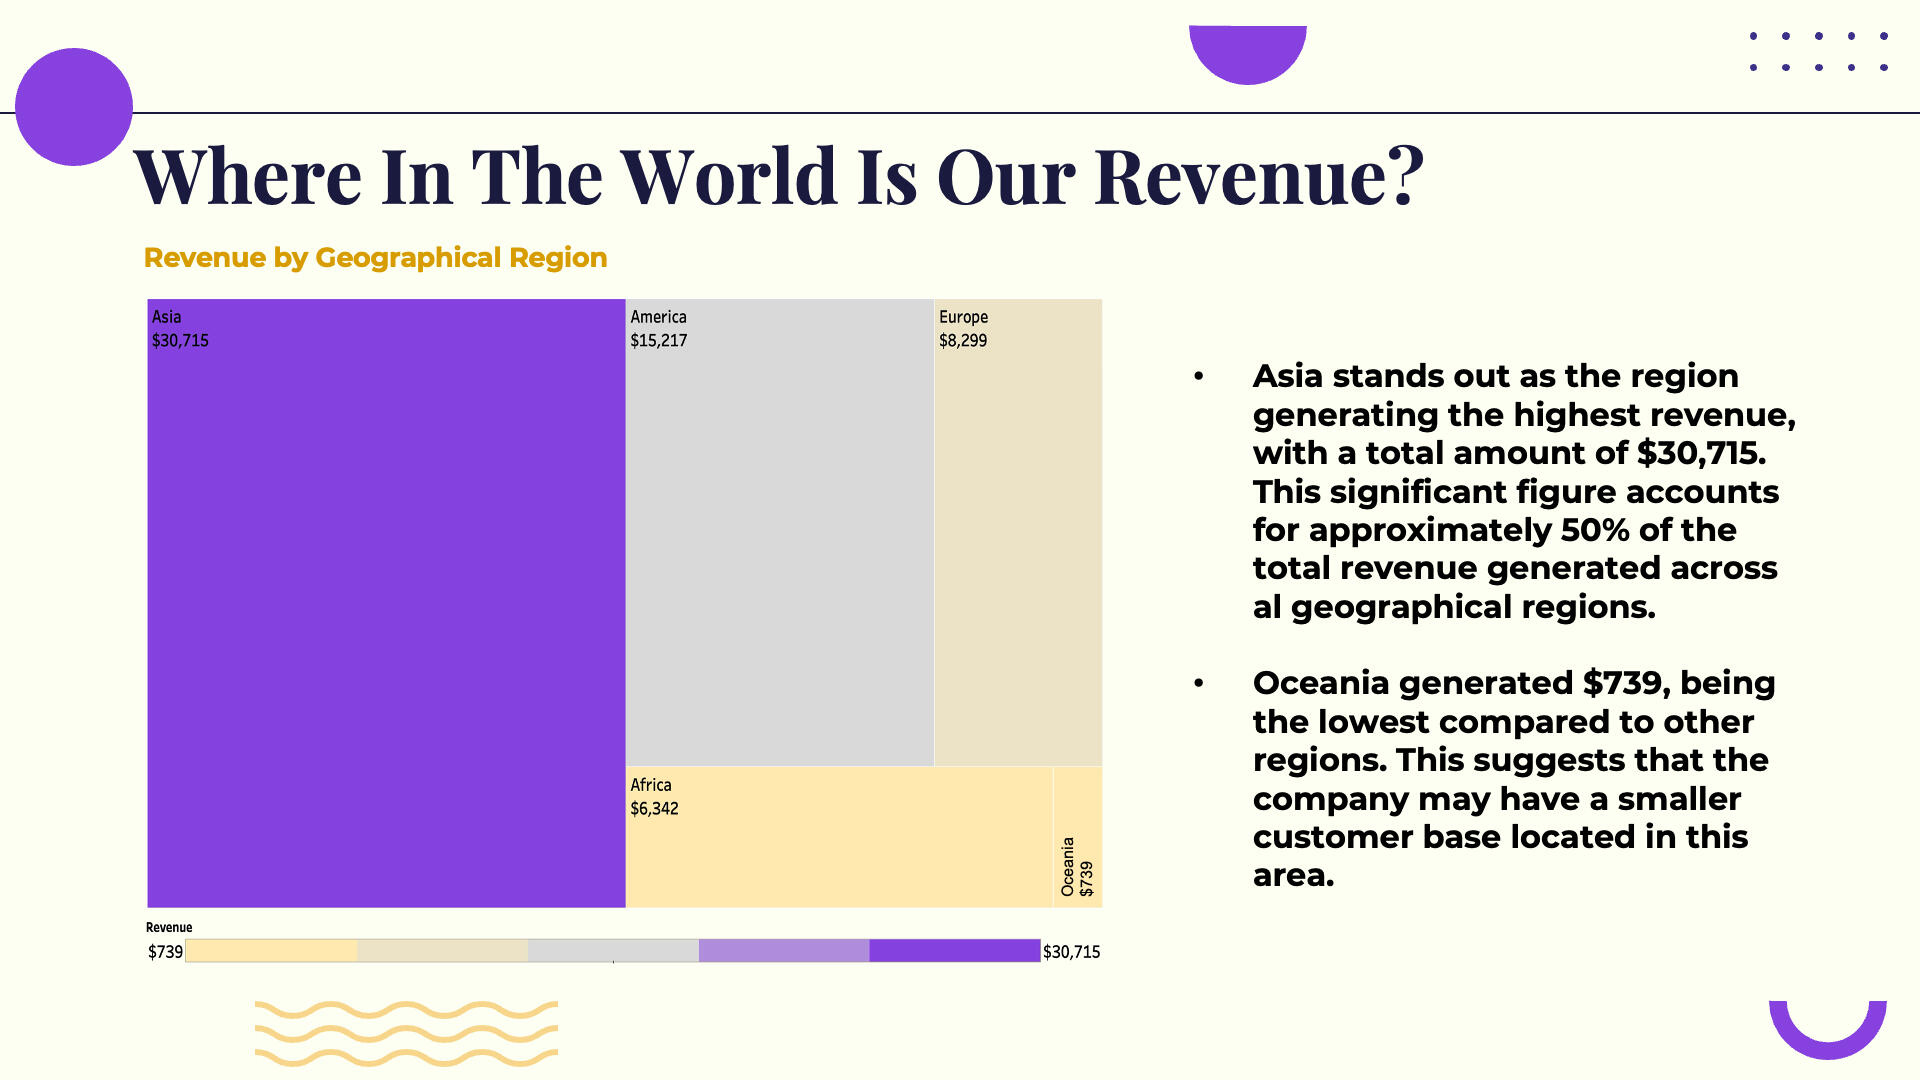
Do sales figures vary between geographic regions?
DATA ANALYSIS
Results
Takeaways
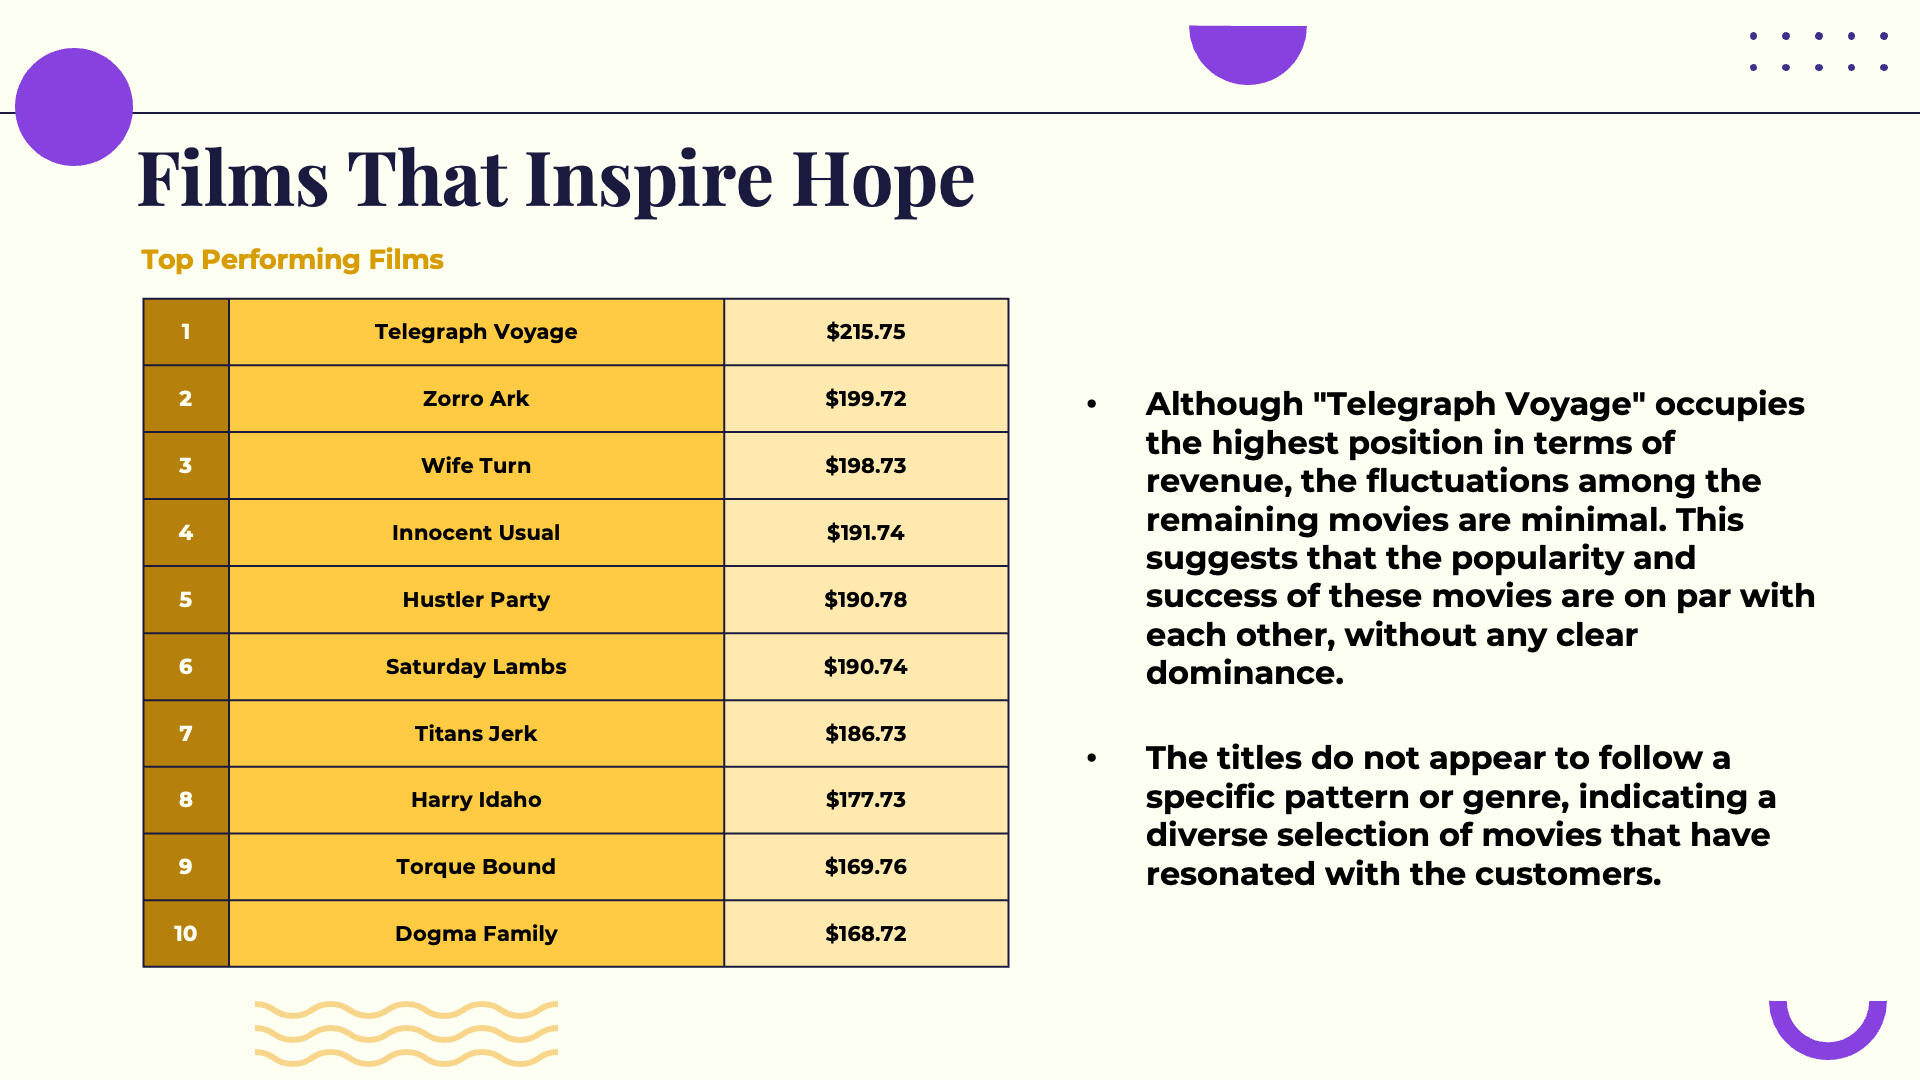
Potential growth opportunities for the movie rental company include expanding further in Asia, leveraging the strong customer base in America, and optimizing strategies in Europe, all of which could lead to increased revenue.
Understanding the popularity and demand for different genres can help the rental company make informed decisions regarding inventory management and marketing strategies.
Customers have diverse preferences, and multiple movies can attract significant viewership and generate substantial revenue. Identifying and prioritizing high-value customers emerges as crucial in recognizing their significant contribution to the company's revenue.
Post-Pandemic Worldwide Layoffs
Problem Statement
From the onset of 2020, layoffs began as immediate responses to the COVID-19 pandemic’s impact on global markets. This analysis seeks to understand the impact on different industries and companies, the geographical distribution of layoffs, and the trends in layoffs over time.
Key Questions
Which industries experienced the highest number of layoffs from 2020 to 2023, and how did these layoffs vary year by year?
How did the number of layoffs in the United States compare to other countries during the same period, and what trends can be observed?
What patterns can be observed in layoffs across major US cities, and which cities consistently faced the highest layoffs from 2020 to 2023?
Data Preparation
The data was sourced from layoffs.fyi and consolidated in Kaggle, available from when COVID-19 was declared as a pandemic (03/11/2020) to present (05/24/2024).The data was imported and preprocessed in a PostgreSQL database, performing procedures like deduplication and standardization.
DATA ANALYSIS
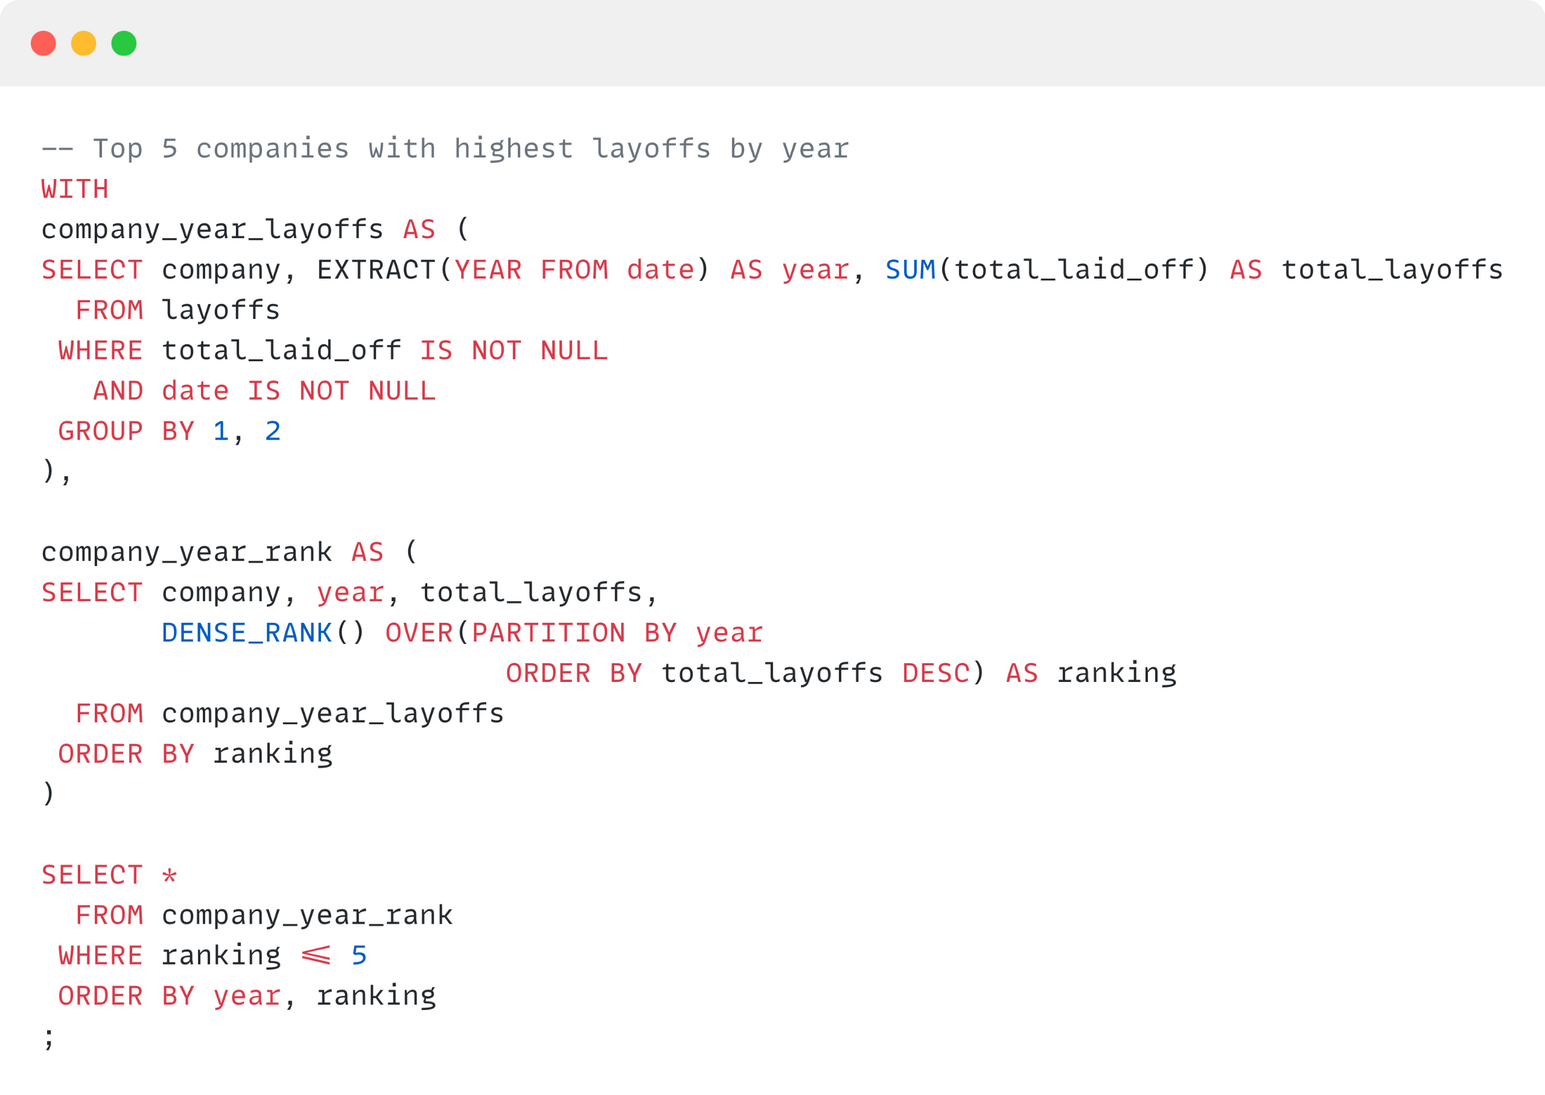
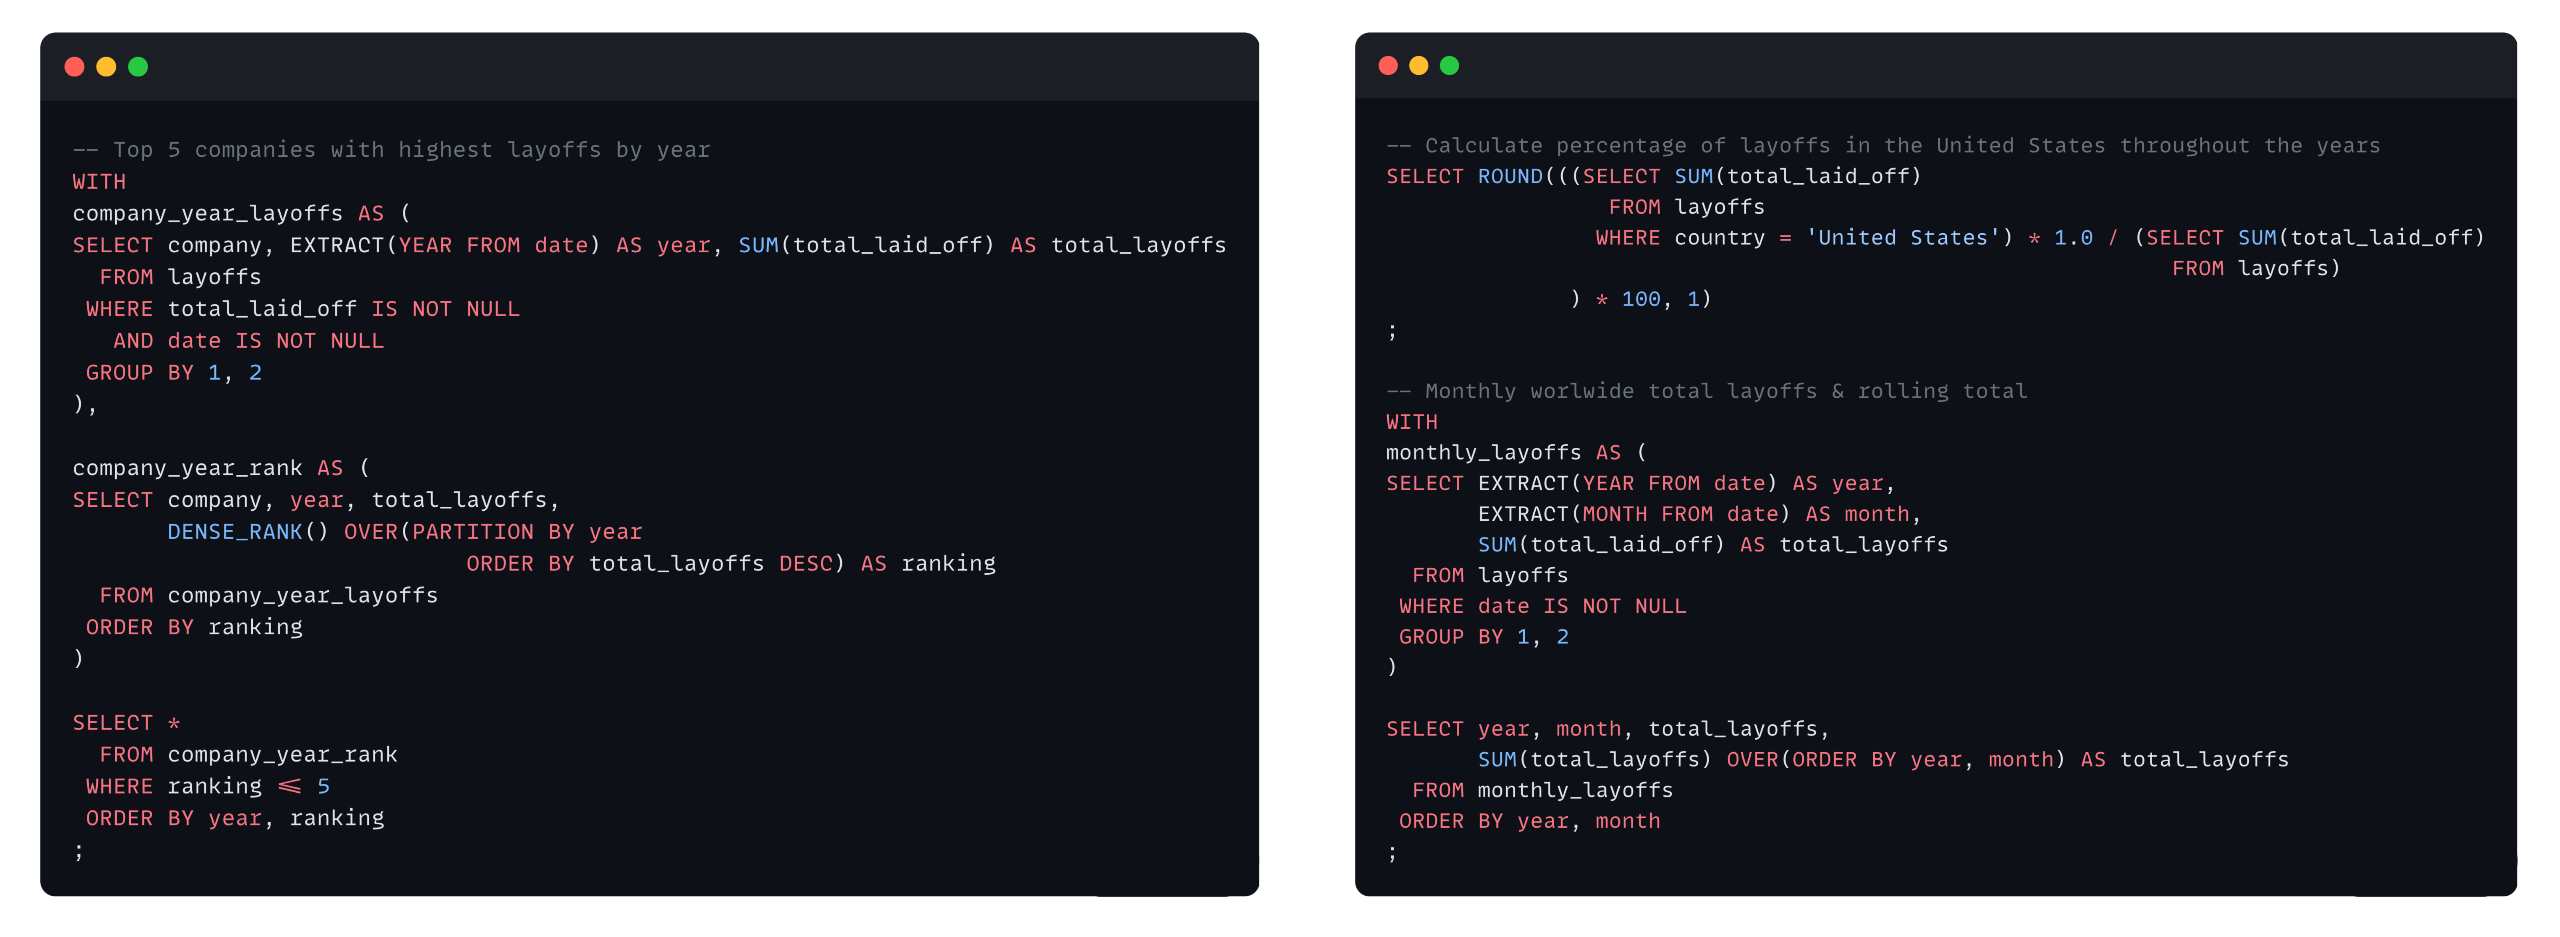
To identify which industries and companies experienced the highest number of layoffs, I calculated the total number of layoffs for each industry over time to see which ones were most affected, and ranked the top 5 companies per year with the highest number of layoffs.To understand the impact of the United States in the global landscape, I calculated the overall percentage of layoffs in the country from 2020 to 2024.To analyze the trends in layoffs over the years, I calculated the monthly layoffs by year and its rolling total from 2020 to 2024, identifying key periods of increase and decrease, such as the stabilization in 2021 and the peak in early 2023.
Results & Takeaways
🏢 Which industries and companies experienced the highest number of layoffs from 2020 to 2024?The tech industry was significantly impacted, with Amazon, Meta, and Google experiencing the highest number of layoffs. Amazon had the highest number of layoffs in 2023, and Tesla led the first half of 2024 with over 14,000 layoffs. Additionally, the consumer and retail industries also faced severe job cuts.🌍 How did the geographical distribution of layoffs vary, and which countries and cities were most affected during the pandemic period?The United States led globally with over 400,000 layoffs, making up about 70% of the total layoffs worldwide. India ranked second with just over 50,000 layoffs. Regionally, the San Francisco Bay Area had the highest number of layoffs until 2024, when Austin, Texas, took the lead with over 22,000 layoffs. Other major cities like New York and Seattle were consistently among the top five with the highest layoffs.📉 What were the trends in layoffs over the years, and how did the numbers change from the peak in 2023 to the first half of 2024?Layoffs spiked in early 2020 due to COVID-19, stabilized in 2021, increased again in 2022, and peaked dramatically in early 2023 with over 250,000 layoffs. In early 2024, there was a significant decrease of about 60% compared to 2023, with approximately 90,000 layoffs, indicating a downward trend and potential economic recovery.
Call Center Help Desk Performance
Problem Statement
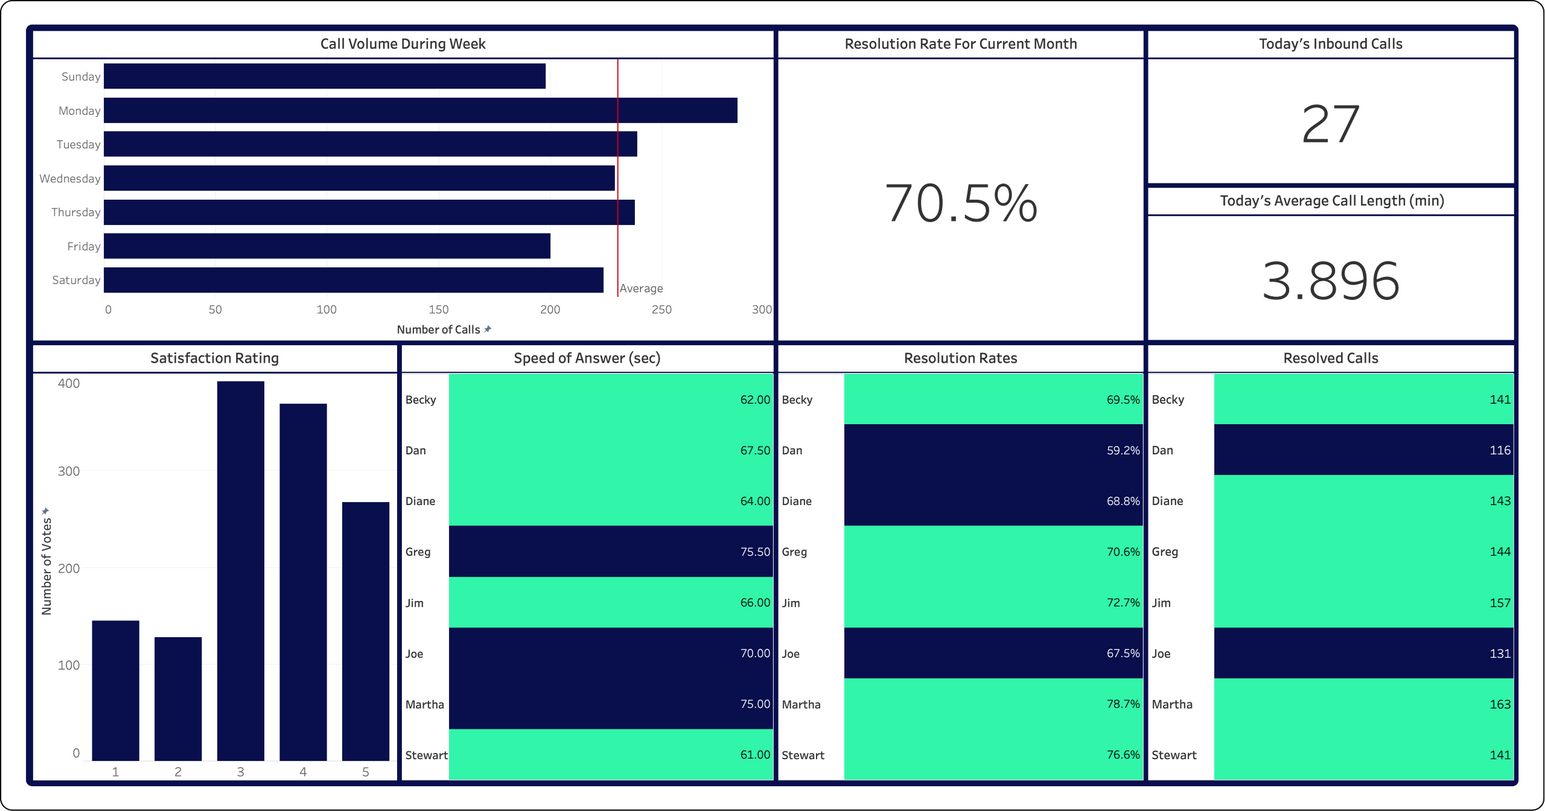
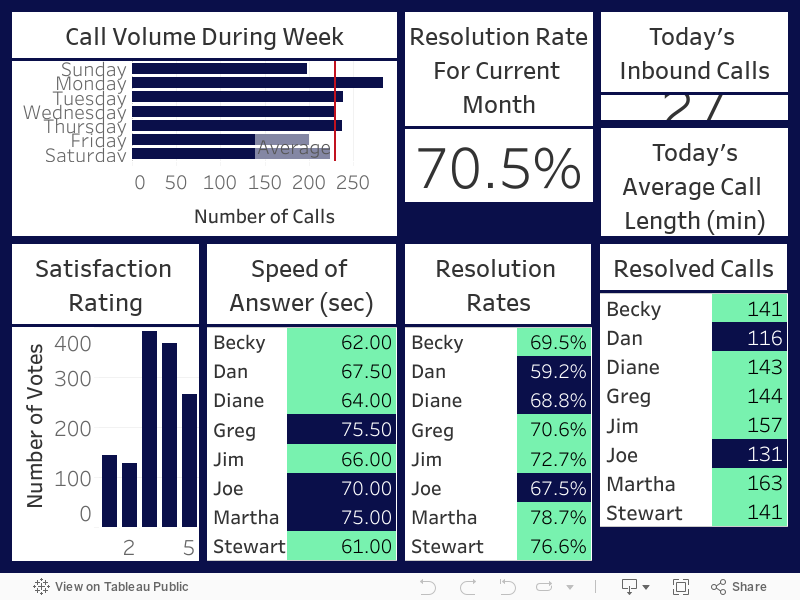
Develop a monthly KPI dashboard for a Call Center Help Desk team, providing actionable insights into employee performance and overall call metrics.
Key Questions
What is the peak weekday for inbound call volume?
Is there a prevalence of positive or negative feedback?
Include performance breakdown for each customer service agent.
DATA ANALYSIS
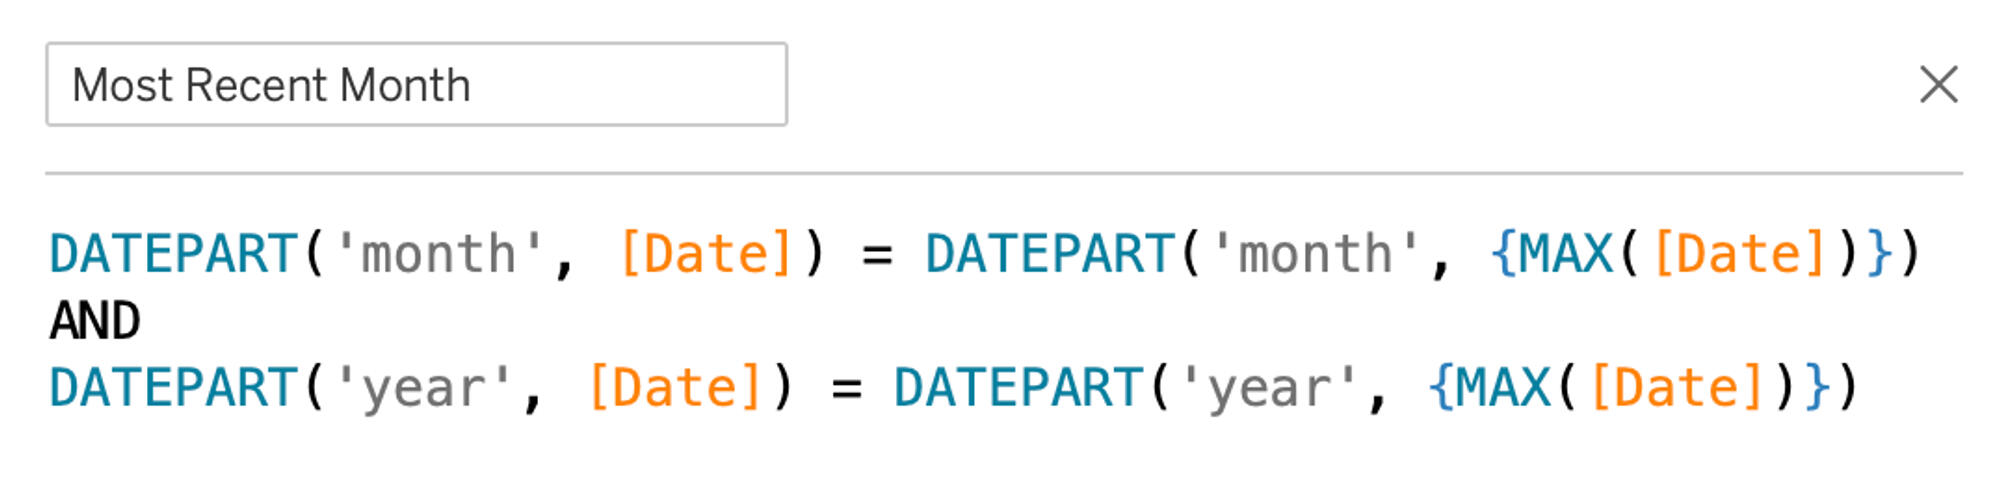
I used bar and column charts to show how inbound calls and satisfaction ratings are distributed across the week, focusing on the current month's data. To filter out only the data from the current month, I marked relevant records as "True" using a boolean field.
Moving on, I wanted to dig deeper into call performance. I calculated the resolution rate by dividing answered calls by total calls and also created a boolean field to filter data for today's inbound calls. Additionally, I calculated today’s average call length in minutes by converting talk duration from seconds.

To assess call service agents, I used two-color highlight tables for resolution rates, number of resolved calls, and speed of answer, highlighting performance differences among agents.
Results & Takeaways
Mondays see the highest call volume, while Sundays have the lowest. Above-average call volume days are Monday, Tuesday, and Thursday. Recommendation: Adjust agent schedules to match call demand, with more agents on busy days and fewer on weekends.
This month's satisfaction rates lean more towards positive than negative, though there are many neutral votes. Recommendation: Investigate neutral and negative feedback to find patterns and implement strategies for improvement.
Agent performance varies widely, with resolution rates being crucial. Recommendation: Offer customer service training and incentives for agents with lower resolution rates to improve performance through friendly competition.
2023 FLU SEASON IN THE UNITED STATES
Problem Statement
Determine when and how many medical staff are needed to respond promptly and effectively to different flu-related needs across U.S. states this upcoming season, with a particular emphasis on vulnerable populations over 65 years old.
Key Questions
What is the timeline for flu season, including its start date, duration, and specific months associated with peak flu activity?
Which states had the highest number of flu and pneumonia cases in 2023, and which states have the largest population of seniors aged 65 and above?
DATA PREPARATION
In this project, we're working with three main sets of data: population figures in the United States broken down by age groups every five years from 2017 to 2022, weekly hospitalization figures for influenza-like illnesses spanning from 2018 to early 2024, and data on influenza/pneumonia deaths by age groups in the U.S. from 2017 to 2020.To start off, the population data was available only as separate datasets for each year. To streamline our analysis, I first compiled all these datasets in their raw form into a single, unified view.Next, both the population data and the influenza/pneumonia mortality data were transformed to present their respective values within distinct five-year age groups, each group being represented in its own column.The necessary data preprocessing steps were performed using Excel before being imported into a PostgreSQL database for further analysis.
DATA ANALYSIS
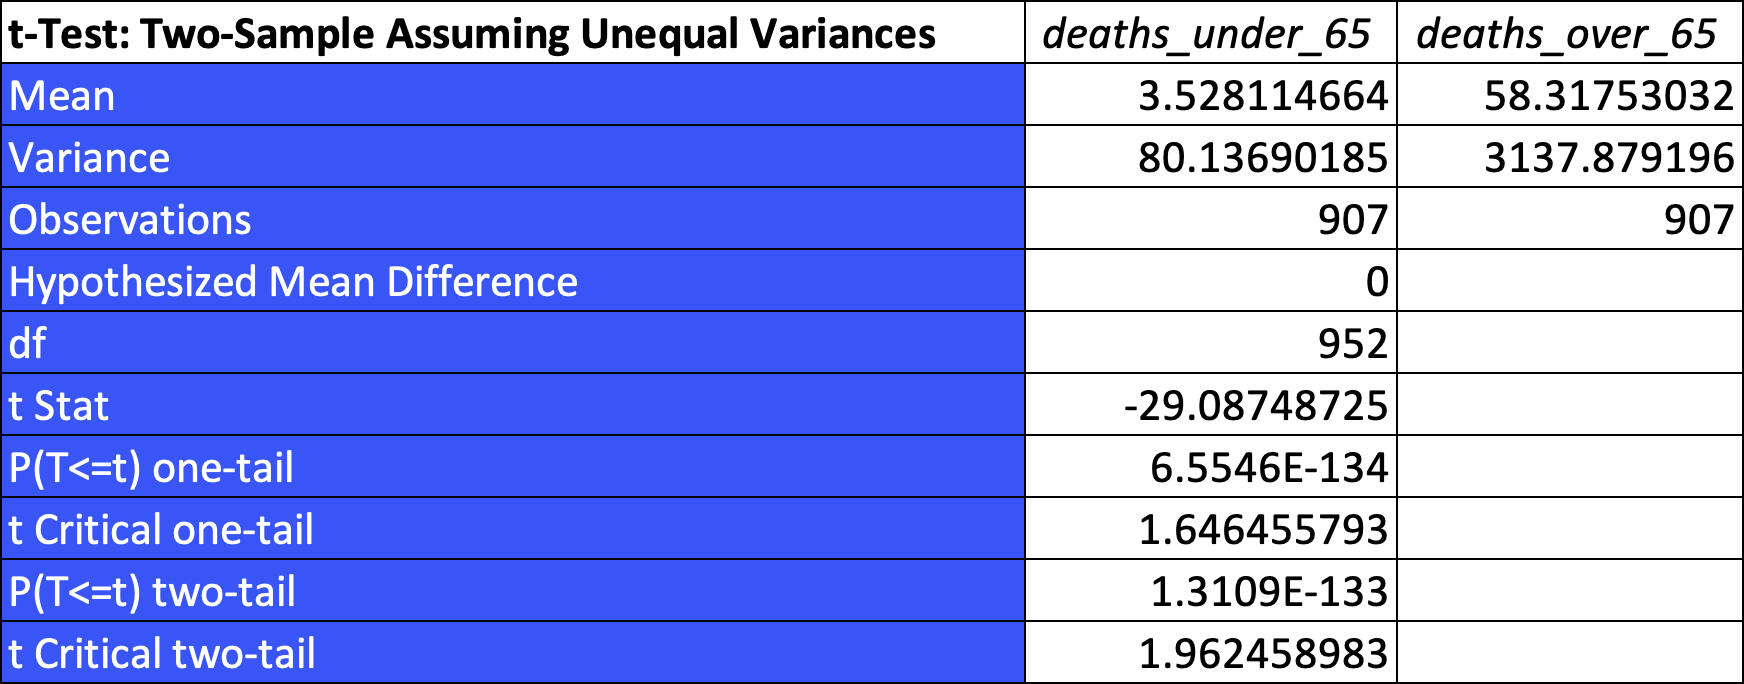
Before delving into the trends of influenza across the nation, let's double-check our initial assumptions for the project. Specifically, we want to see if places with more people over 65 years old are more likely to have higher mortality rates from influenza/pneumonia.To check this out, I did a two-sample t-test, assuming that the variations in data aren't the same. This test basically helps us figure out if there's a significant difference between the average number of deaths from influenza/pneumonia for people over and under 65 years old.
To create a solid plan for medical staffing during the upcoming flu season, our first step is to get a grip on the trends of the illness across the country.
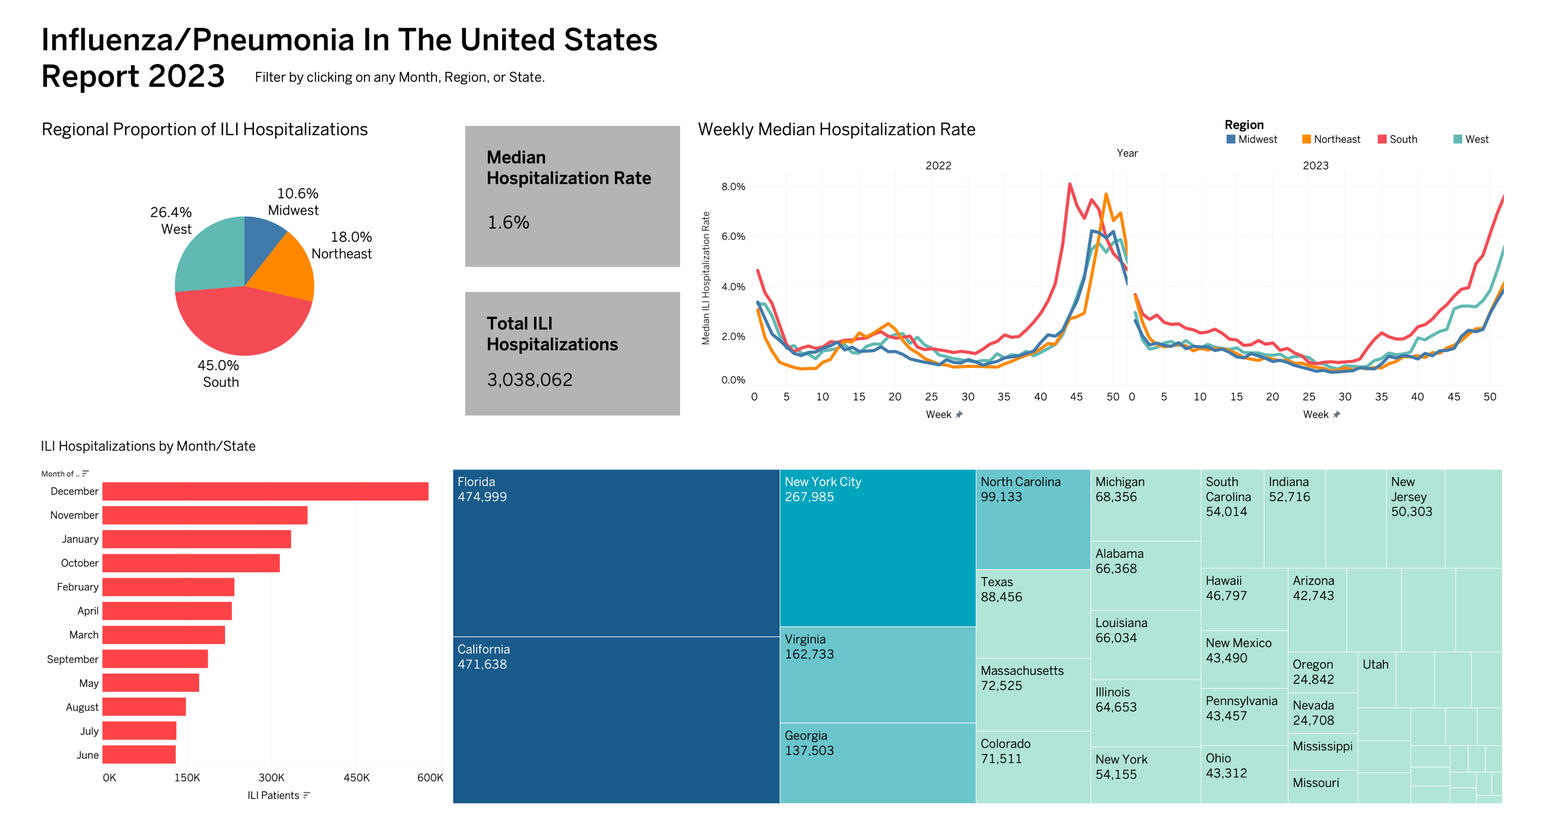
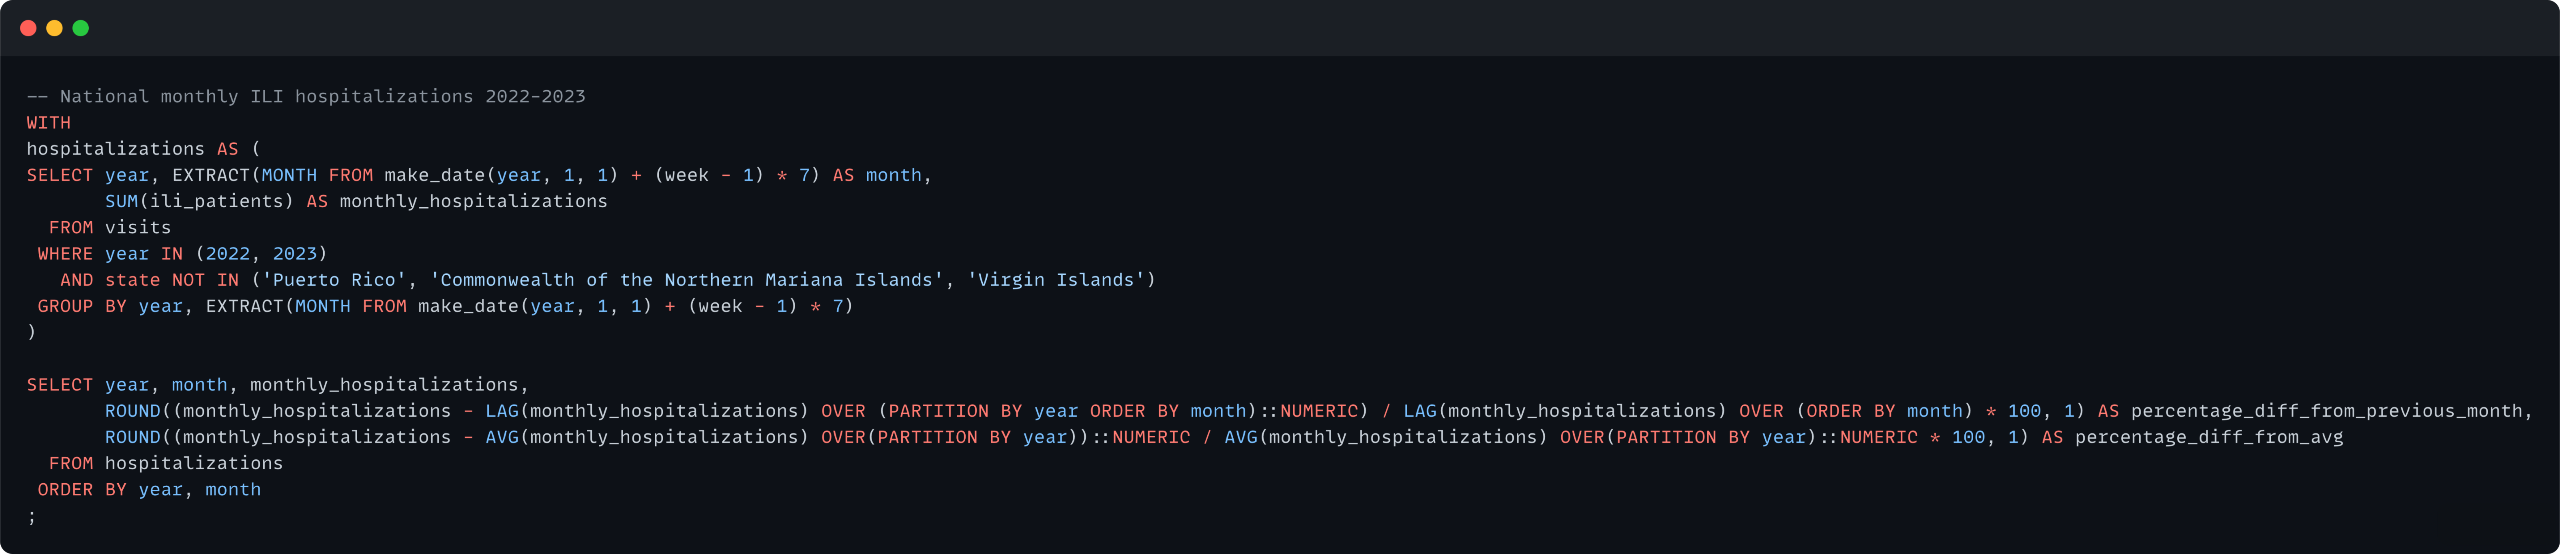
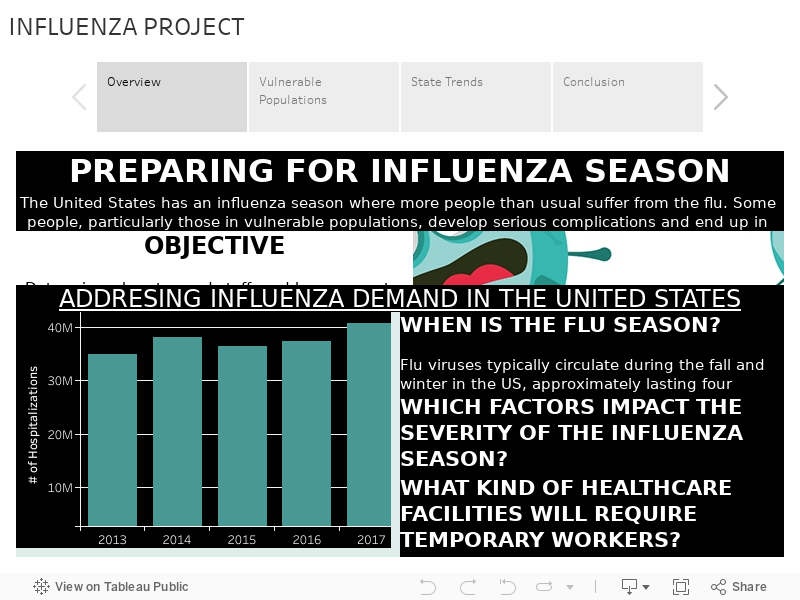
This query returns the total monthly hospitalizations for influenza-like illnesses (ILI) throughout the U.S. each month in 2022-2023. It also gives us the percentage difference from the previous month and the percentage difference from the average hospitalizations each year.
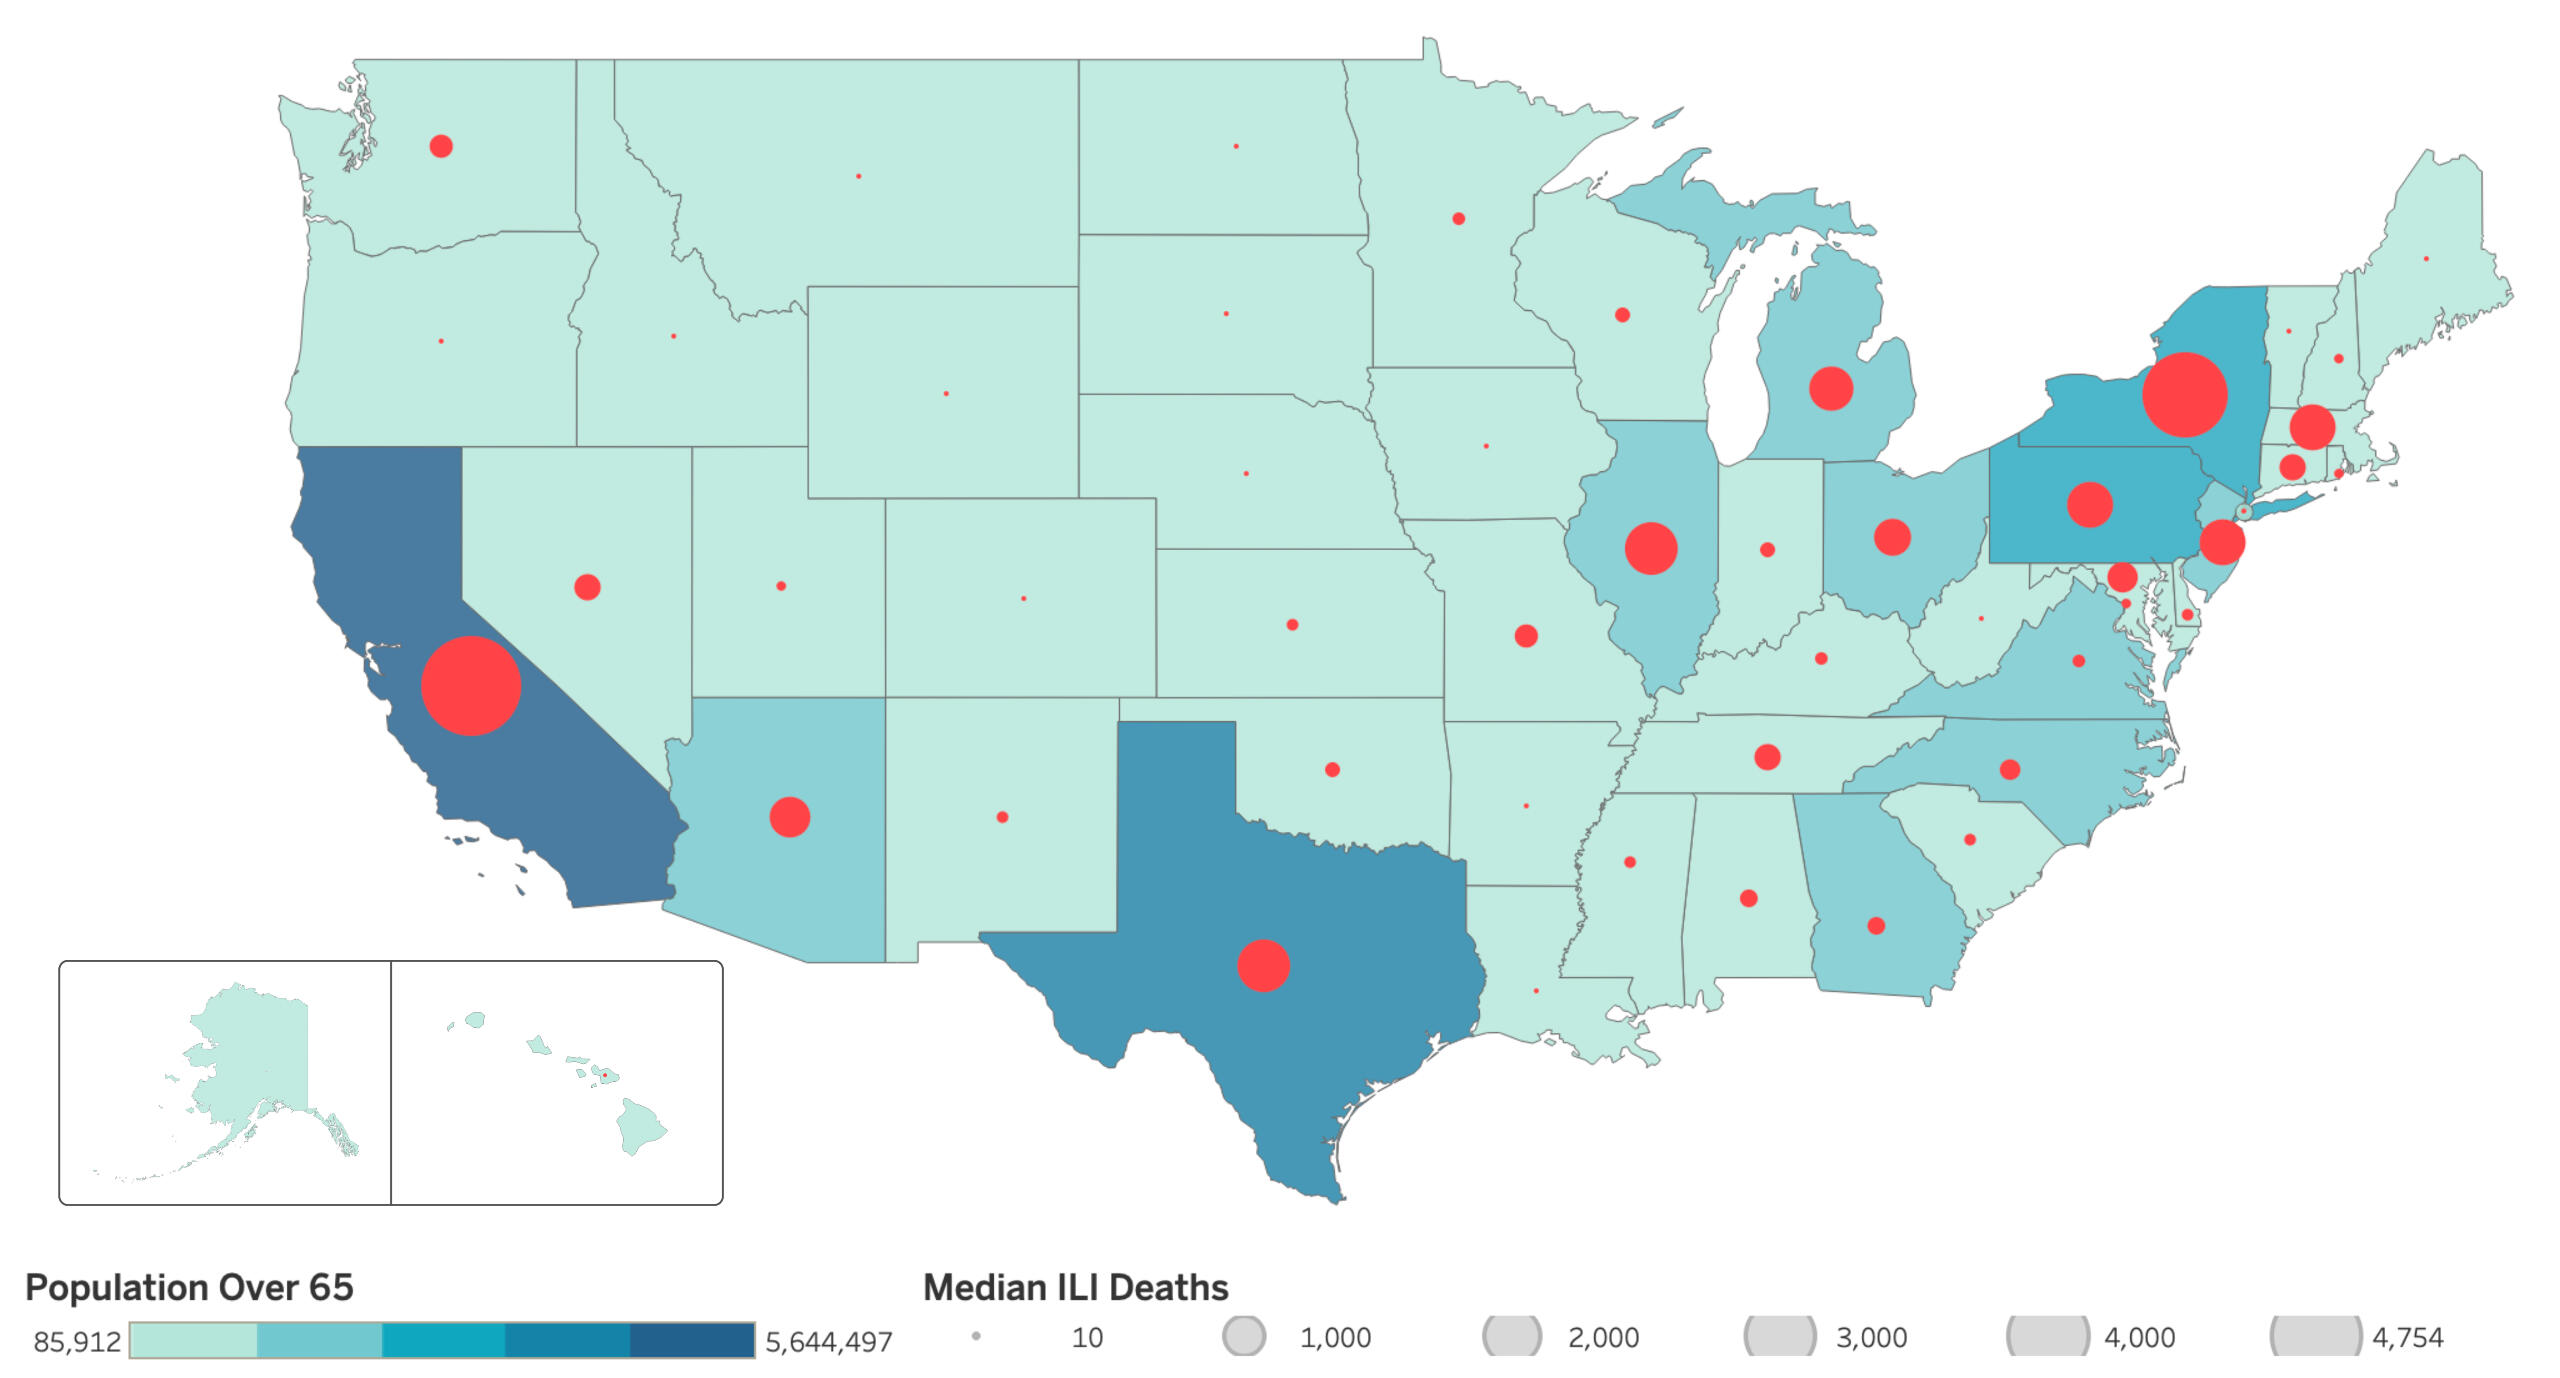
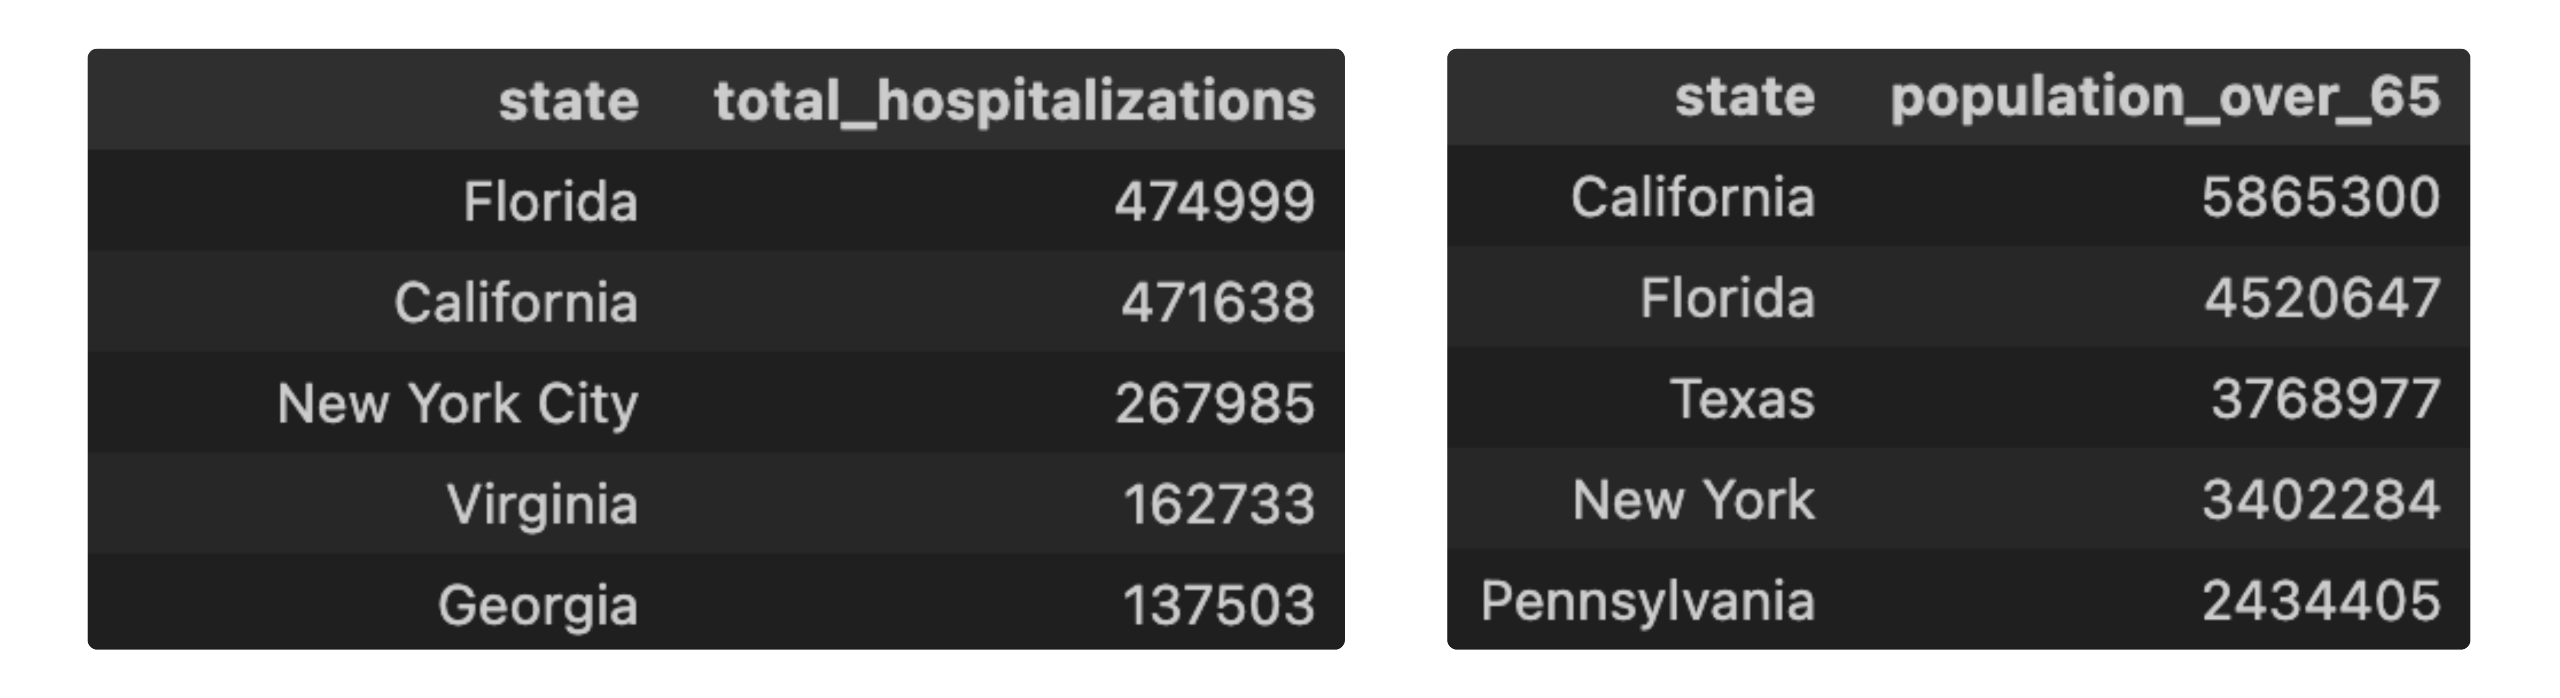
Next up, we want to know which states were hit hardest by ILI in 2023 and how they stack up against states with a higher population of folks over 65 years old. This map lays out the 2022 population numbers of individuals over 65 and the median deaths from influenza/pneumonia in 2023 in the United States.
Results & Takeaways
The flu season typically ramps up during the fall and winter months when influenza cases surge. In 2023, we witnessed the flu gaining momentum in October, reaching its peak in December and leading to over 500,000 hospitalizations across the United States. Flu season usually spans a few months, with the activity lasting approximately 26 weeks from October 2022 through January 2023. Notably, November and December tend to see the highest flu activity.
Regions with a higher percentage of individuals aged 65 years or older tend to experience elevated mortality rates due to influenza/pneumonia illnesses, with a confidence level of 95%. This means that we can be 95% confident that states with more elderly residents have higher fatalities from influenza/pneumonia.
The states most affected by influenza-like illnesses in 2023 include Florida, California, New York, Virginia, and Georgia. Among these, California, Florida, and New York boast some of the largest populations of individuals aged 65 and older. Hence, these states are given top priority for deploying additional medical staff.
SUBSCRIPTION PAYMENT FUNNEL ANALYSIS
Problem Statement
Gain a comprehensive understanding of each stage of the payment process from the user's perspective, pinpointing the exact stage where users are encountering issues and subsequently disengaging.
Key Questions
What percentage of users are unable to complete the payment process due to errors in payment submission and vendor processing?
What is the user base ratio for payment completion, considering only users that have reach the “Completed” stage of the process?
DATA ANALYSIS
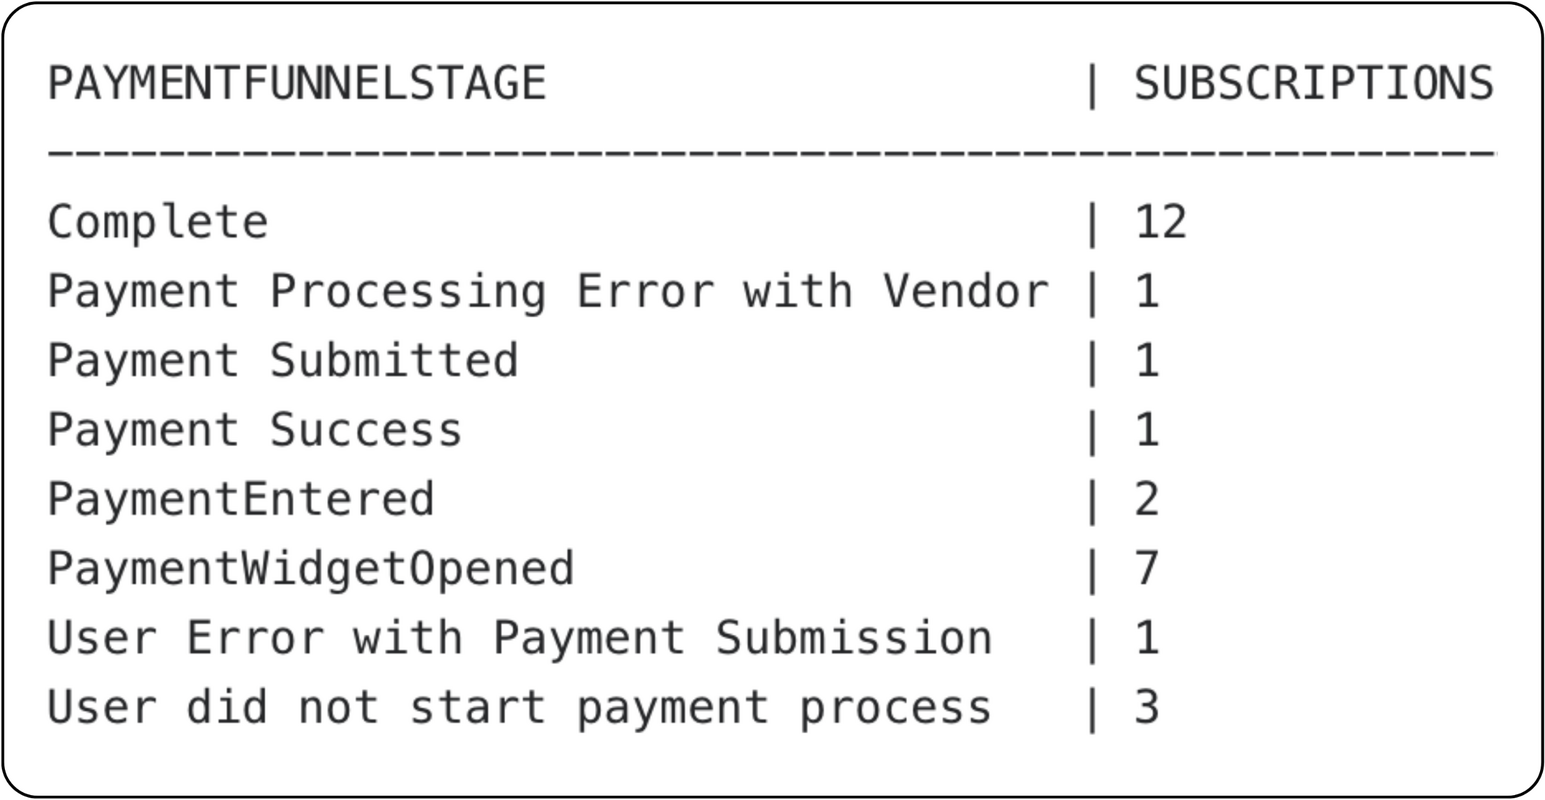
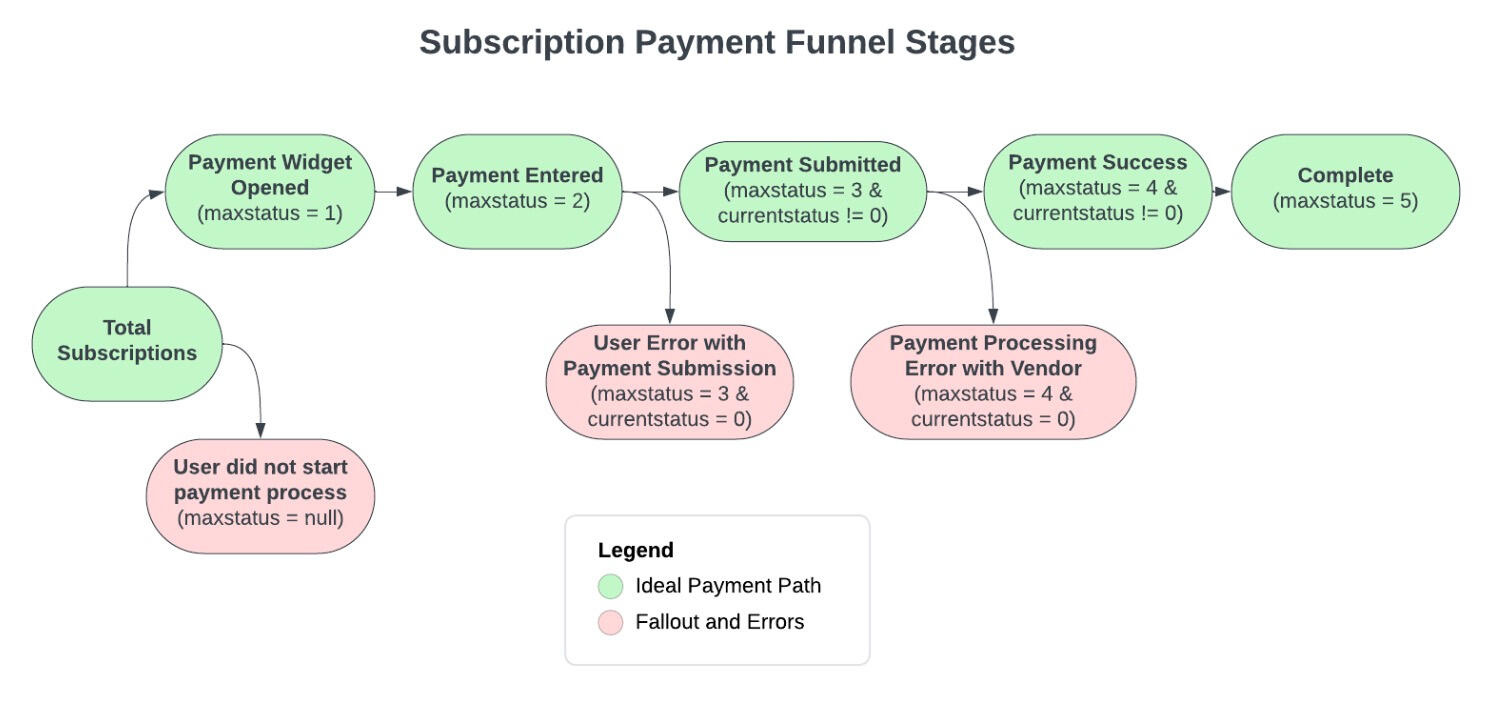
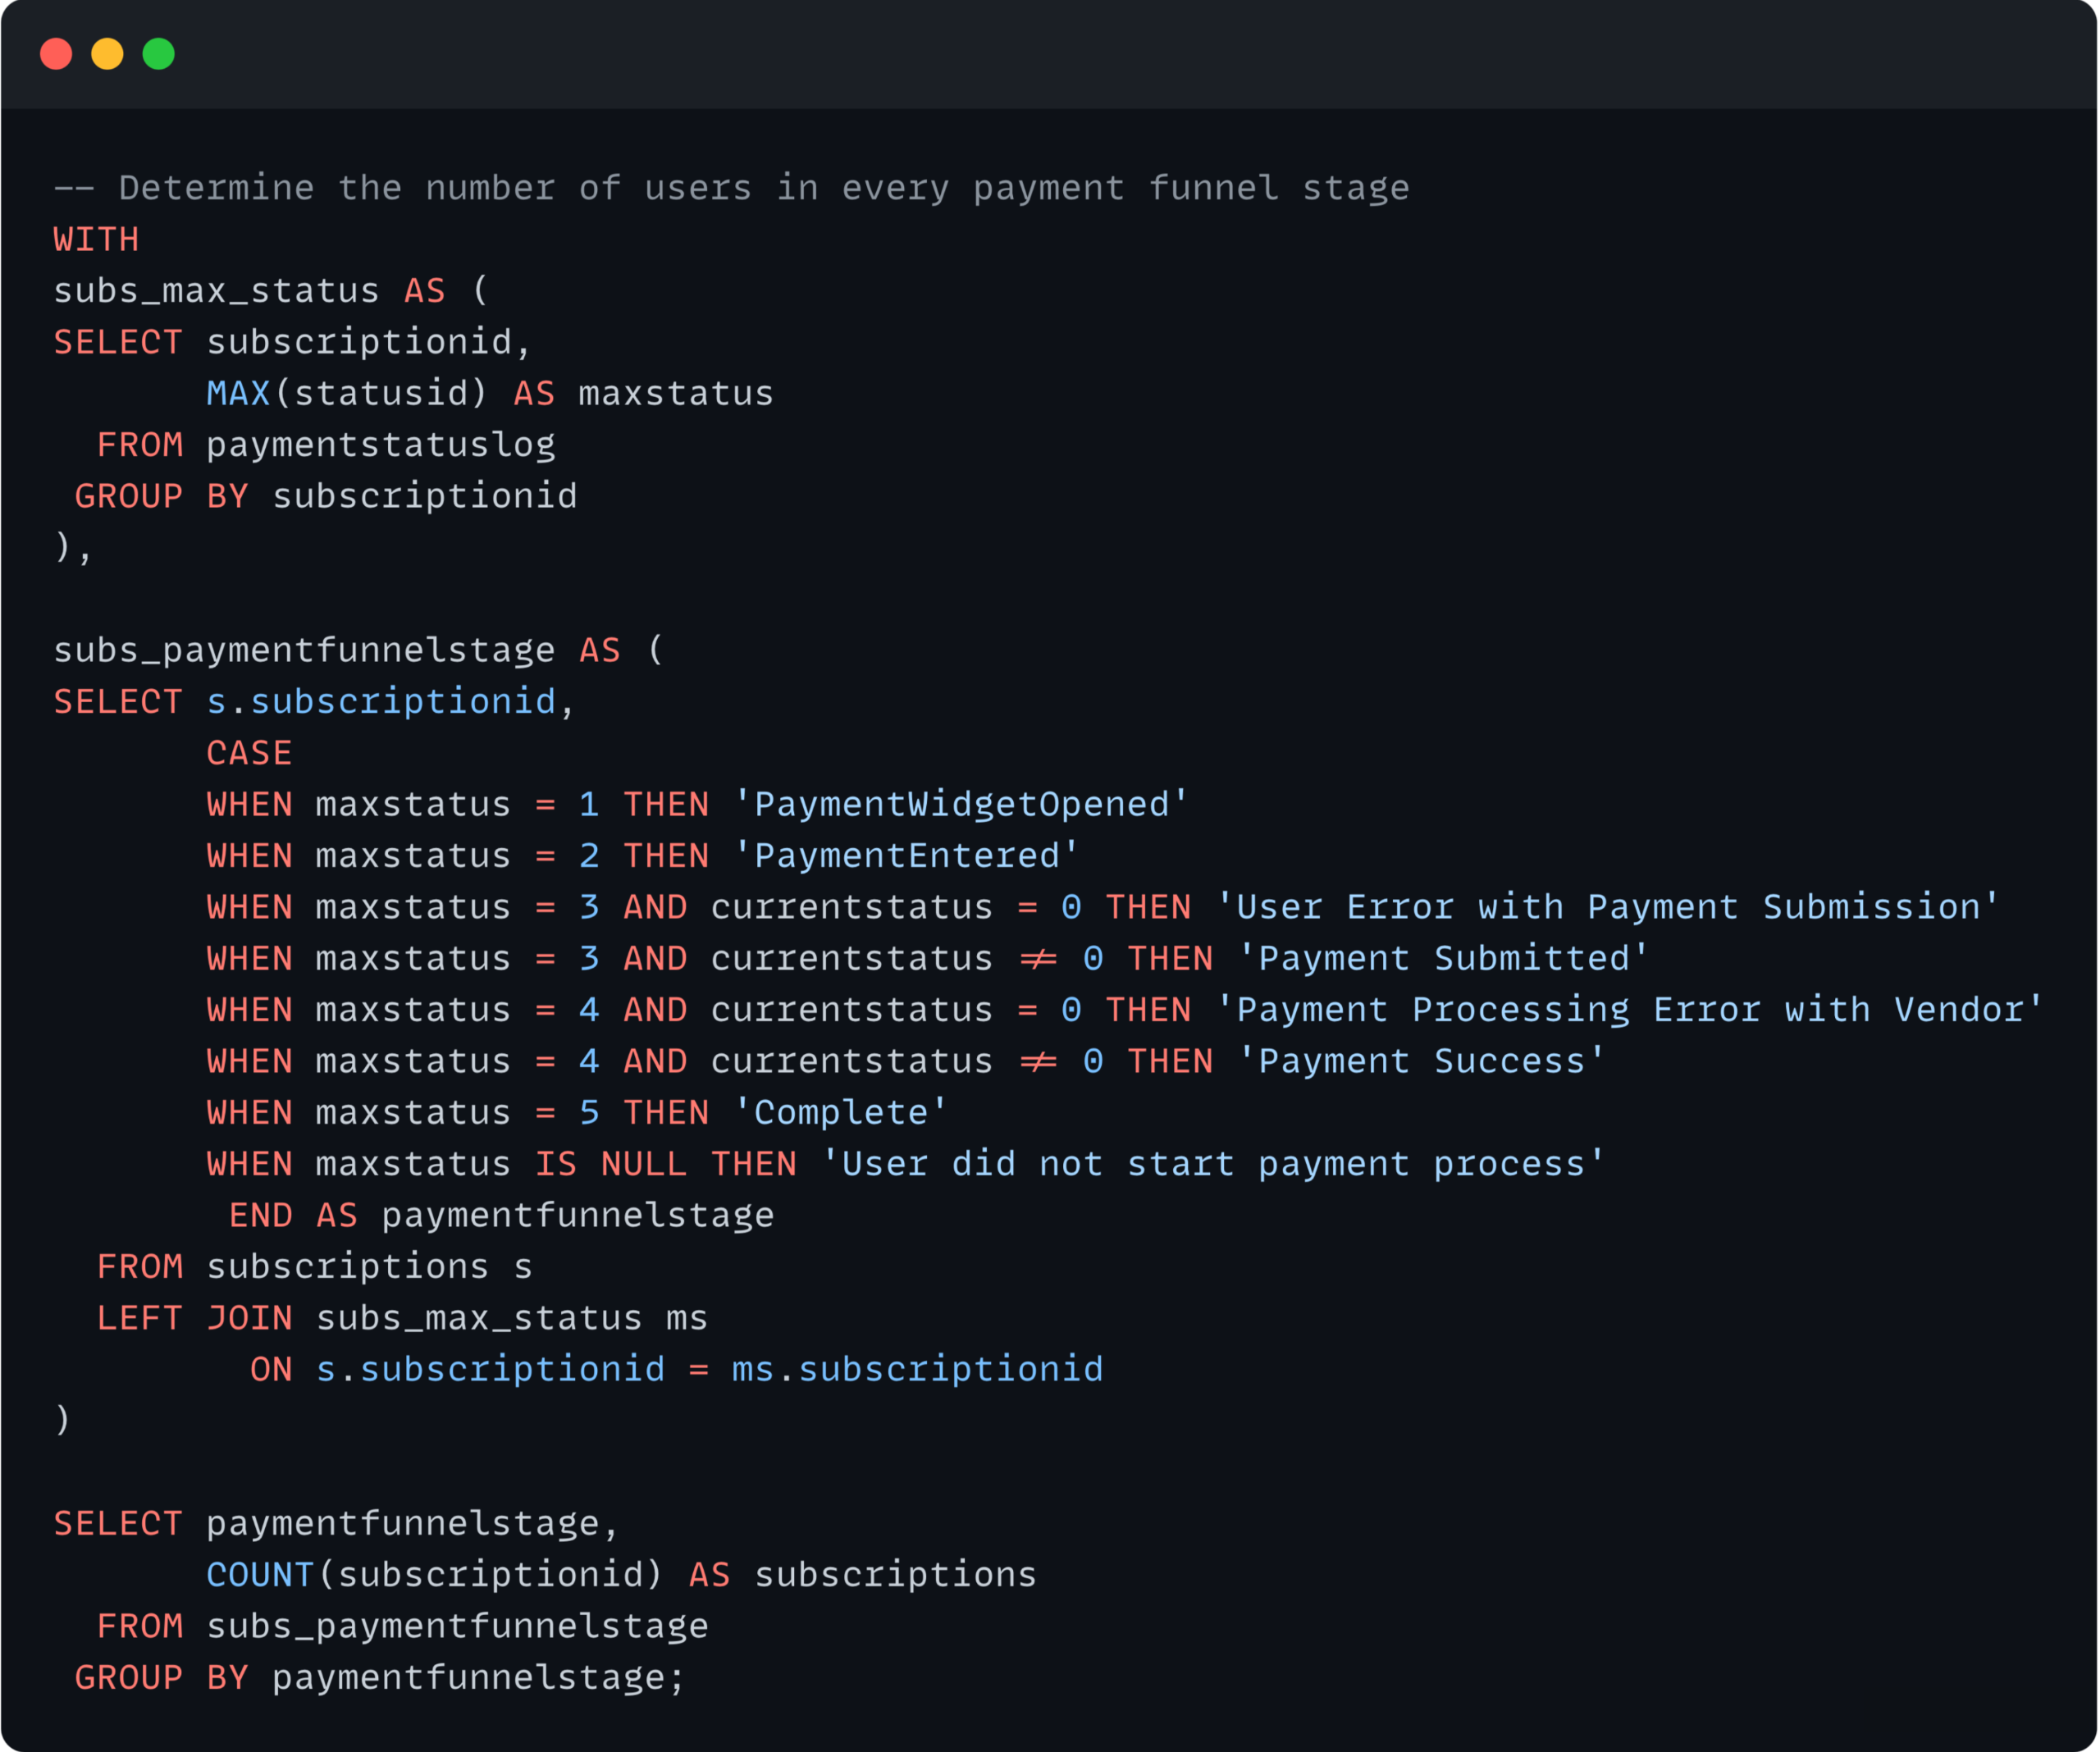
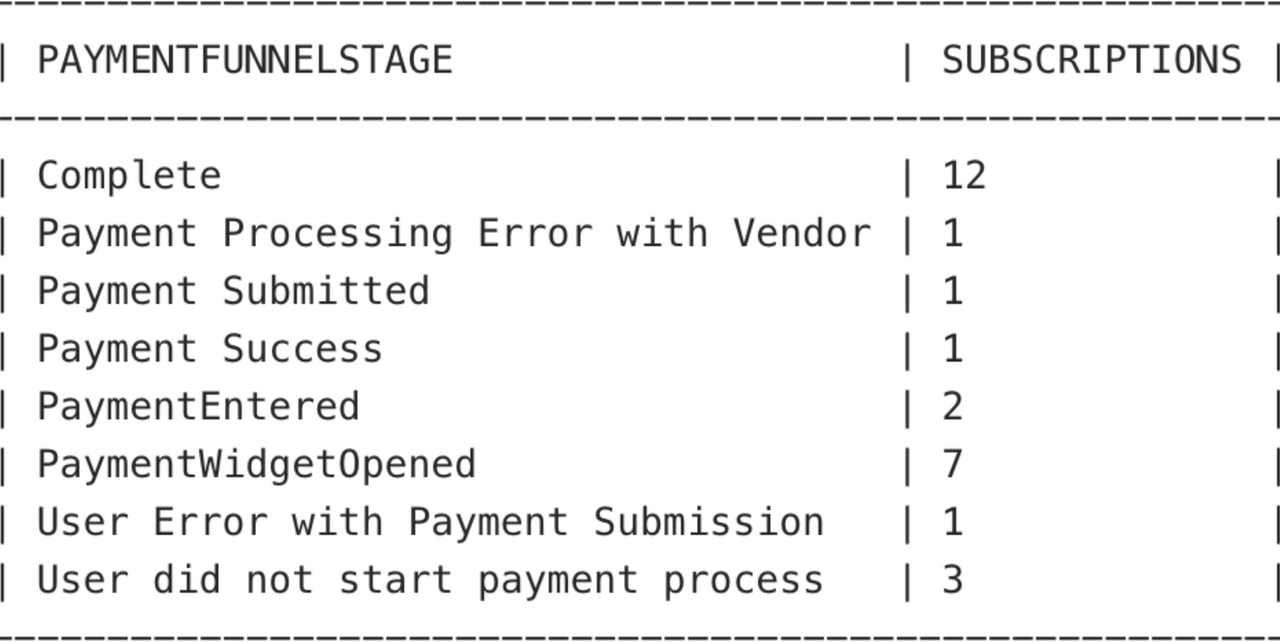
To figure out where a subscription stands in its payment journey, I looked at its highest StatusID. This gives us a glimpse of the farthest point the user got to in the process, regardless of whether they successfully completed it, encountered an error and retried, or faced an error, gave up, and exited the workflow.Besides checking the max status attained, we also want to know if the subscription is currently stuck in an error. For instance, if a user hits StatusID = 3 but inputs an incorrect card number, the transaction halts, and an error message pops up. The user then has to start over with the correct info – that's classified as a user error. On the other hand, if a user reaches StatusID = 4, submits the right payment details, and the data is sent to a third-party payment company, encountering an error on their end will trigger an error message for the user – categorized as a vendor error.
Results & Takeaways
Out of all the users, 25% opened the widget to start the process but didn't move past the first step. Less than 10% of users encountered problems when submitting or processing payments.
The payment completion rate stands at around 43%, considering the users who have reached the "Complete" stage of the process. The main reason for the lower completion rate is users starting the process but not finishing it, rather than being hindered by technical issues.
Health & Economic Worldwide Dynamics
Problem Statement
Examine the global landscape to understand the dynamics between health and economic main drivers, with a focus on discerning patterns and disparities among developed and developing nations.
Key Questions
How does the relationship between GDP and schooling levels vary in relation to life expectancy?
What differences exist in life expectancy between developed and developing nations?
Data Analysis
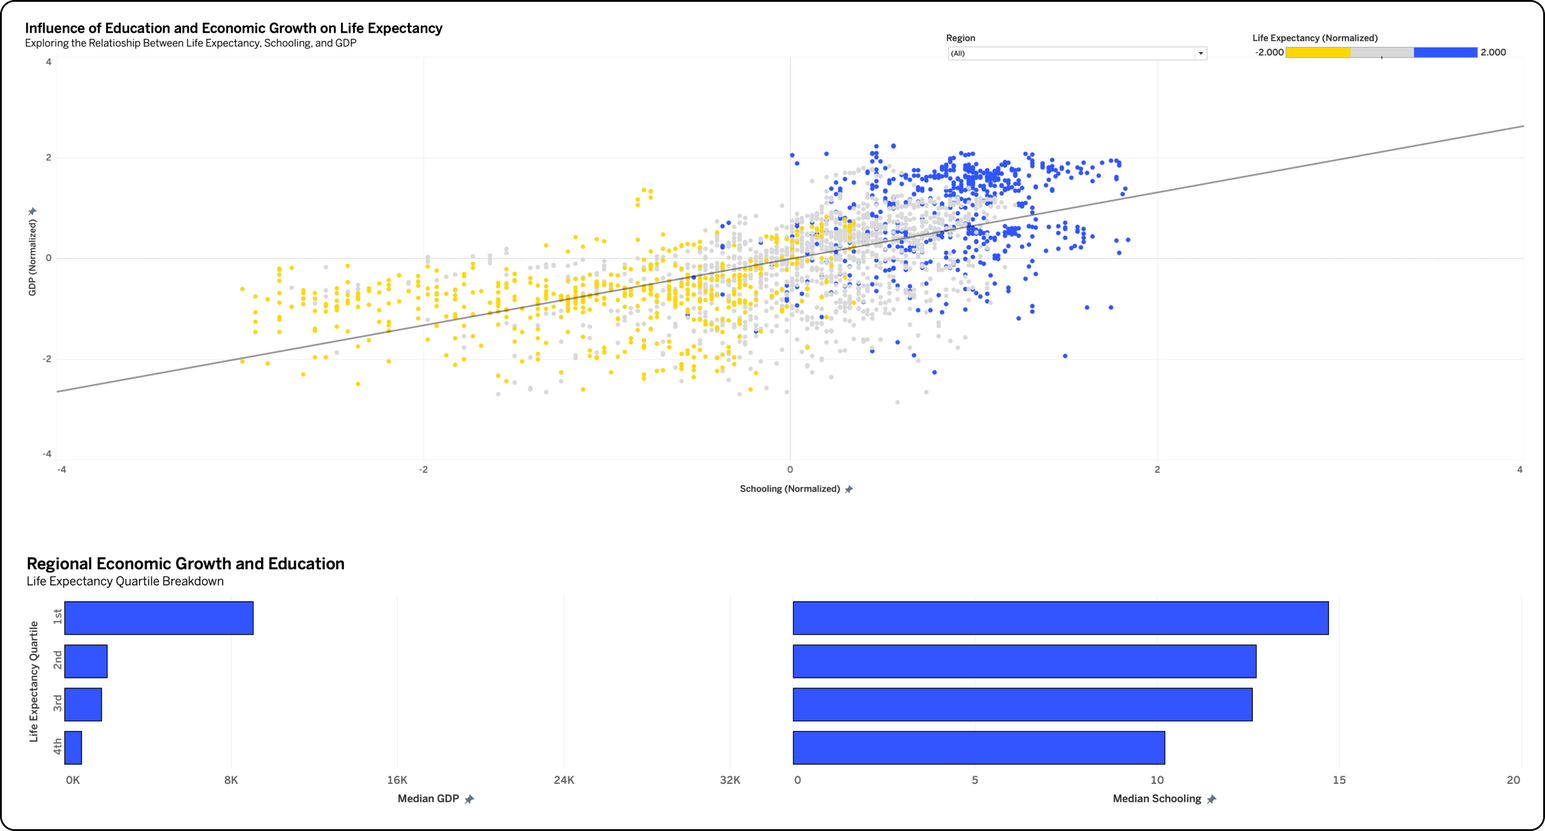
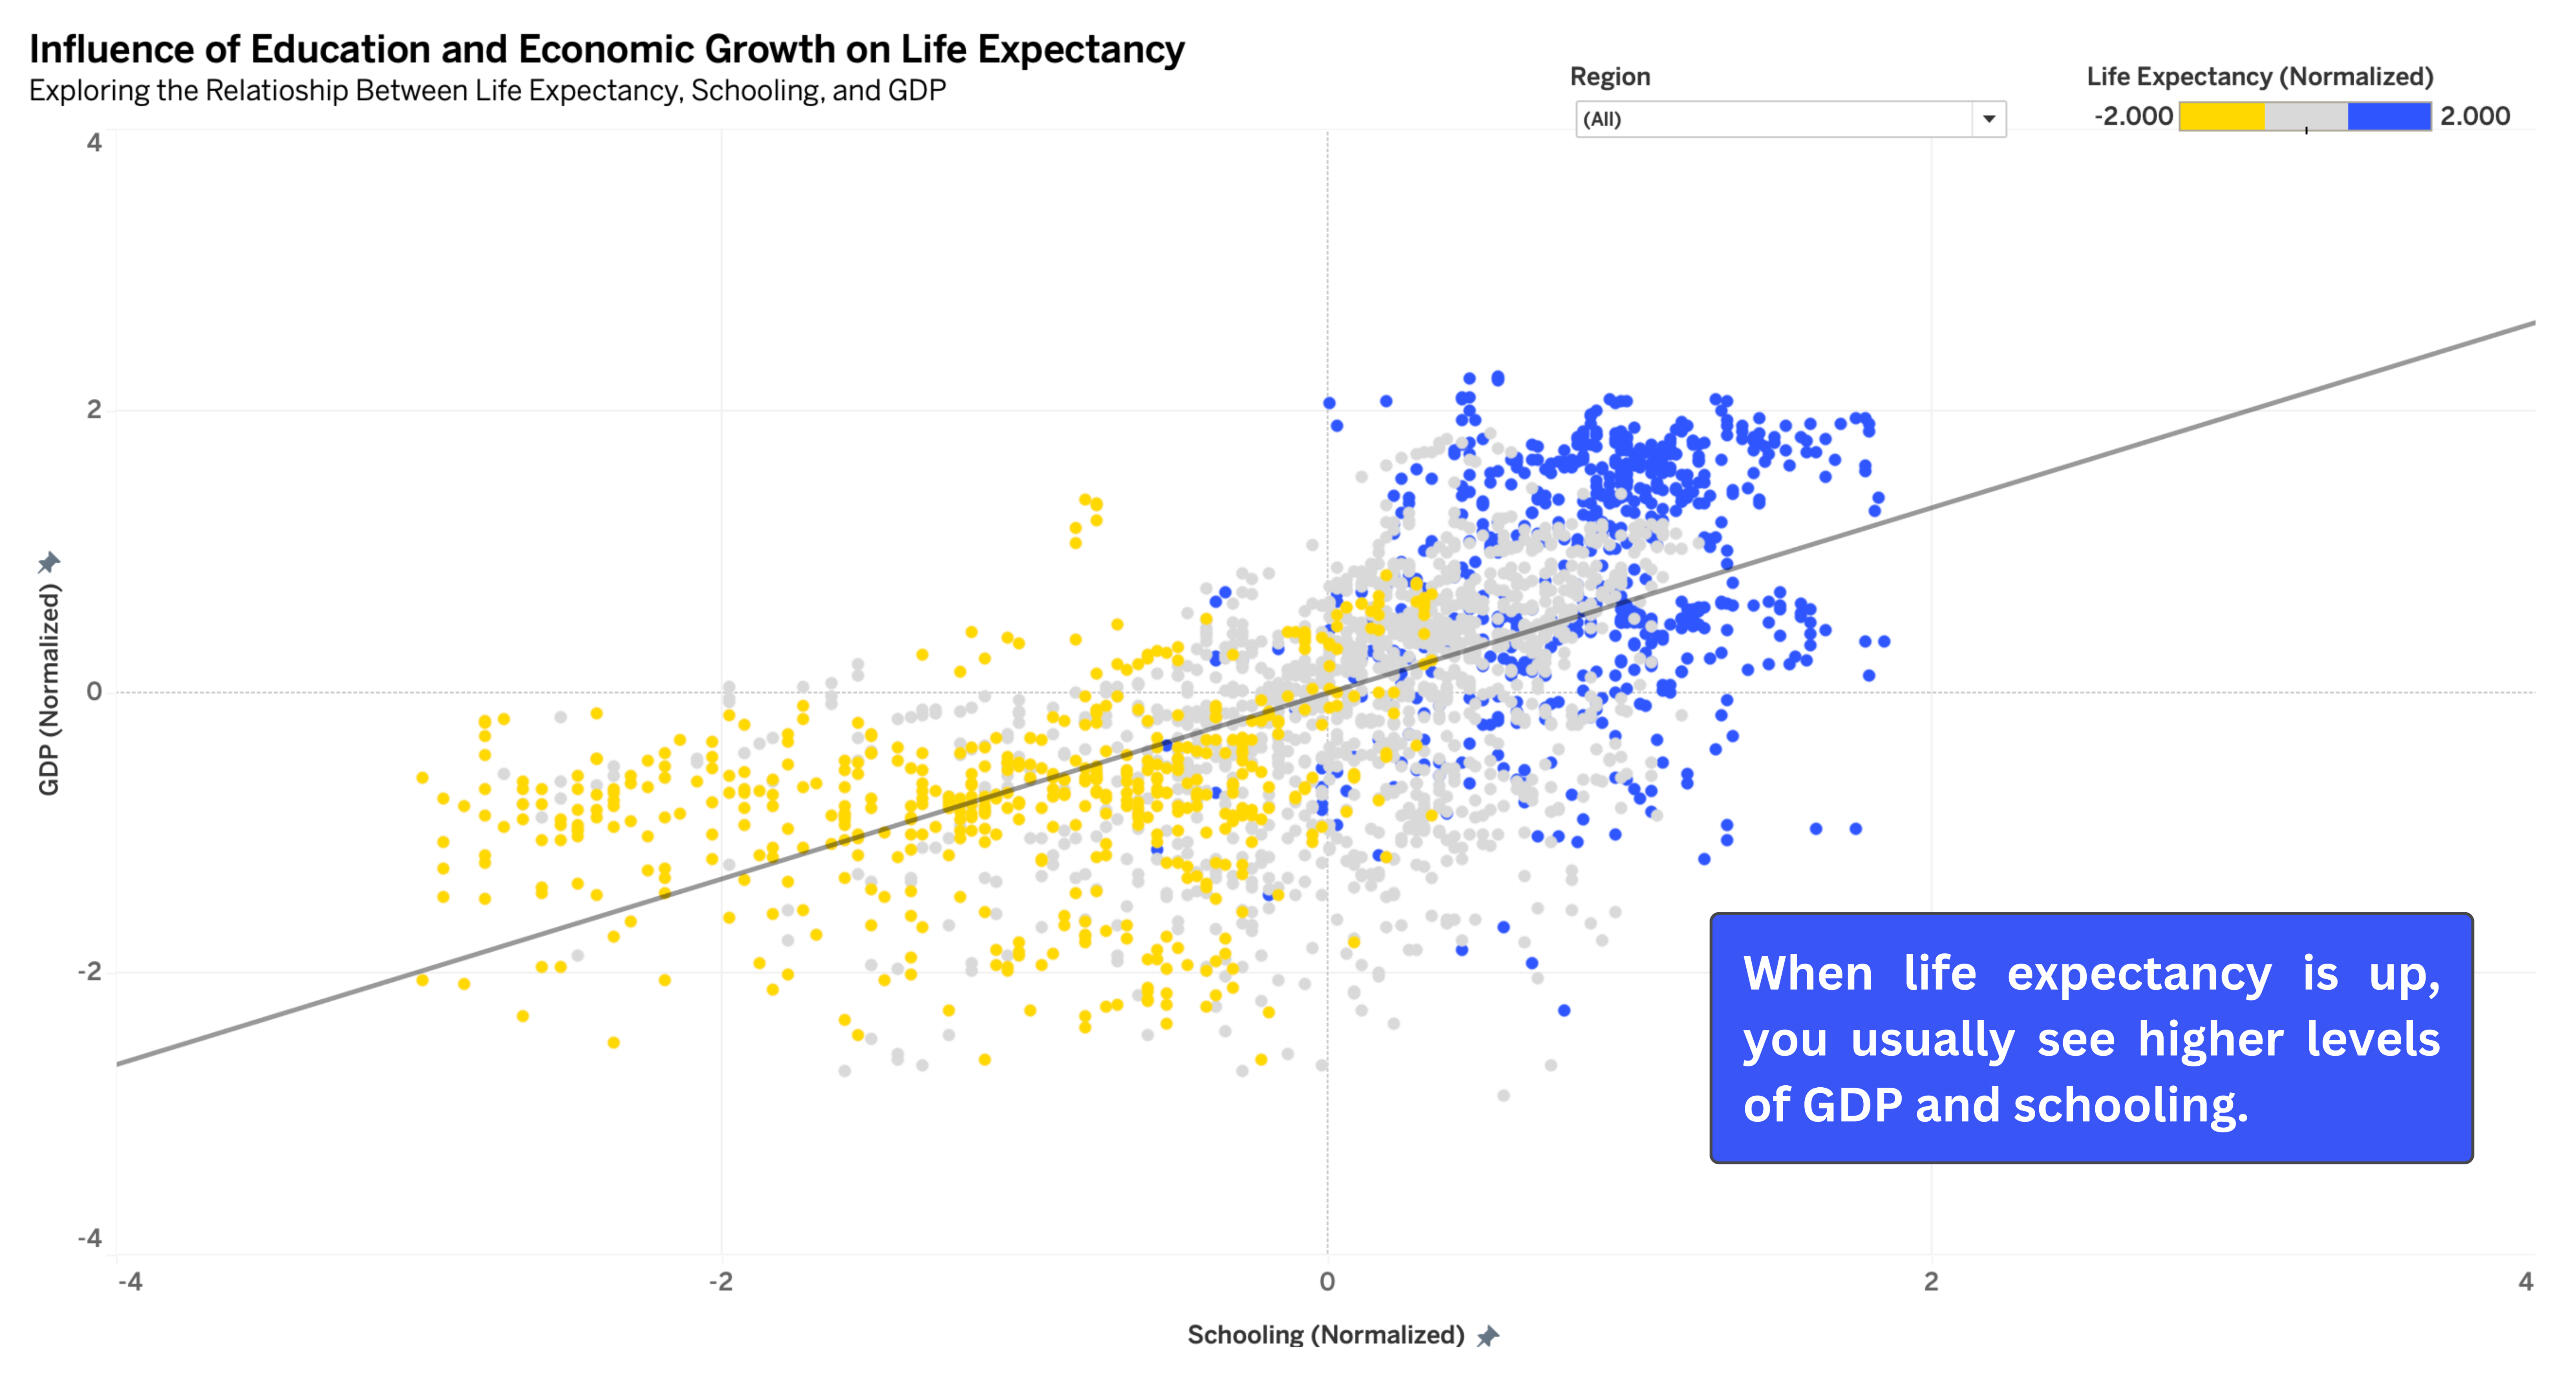
To dig into how life expectancy, GDP, and schooling connect, I started by making sure the three things played fair. I standardized them, basically making them all speak the same language. This helps keep things unbiased. After that, I threw them into a scatterplot. Picture this: GDP and Schooling on the X and Y axes, and the color showing life expectancy. Cool, right?
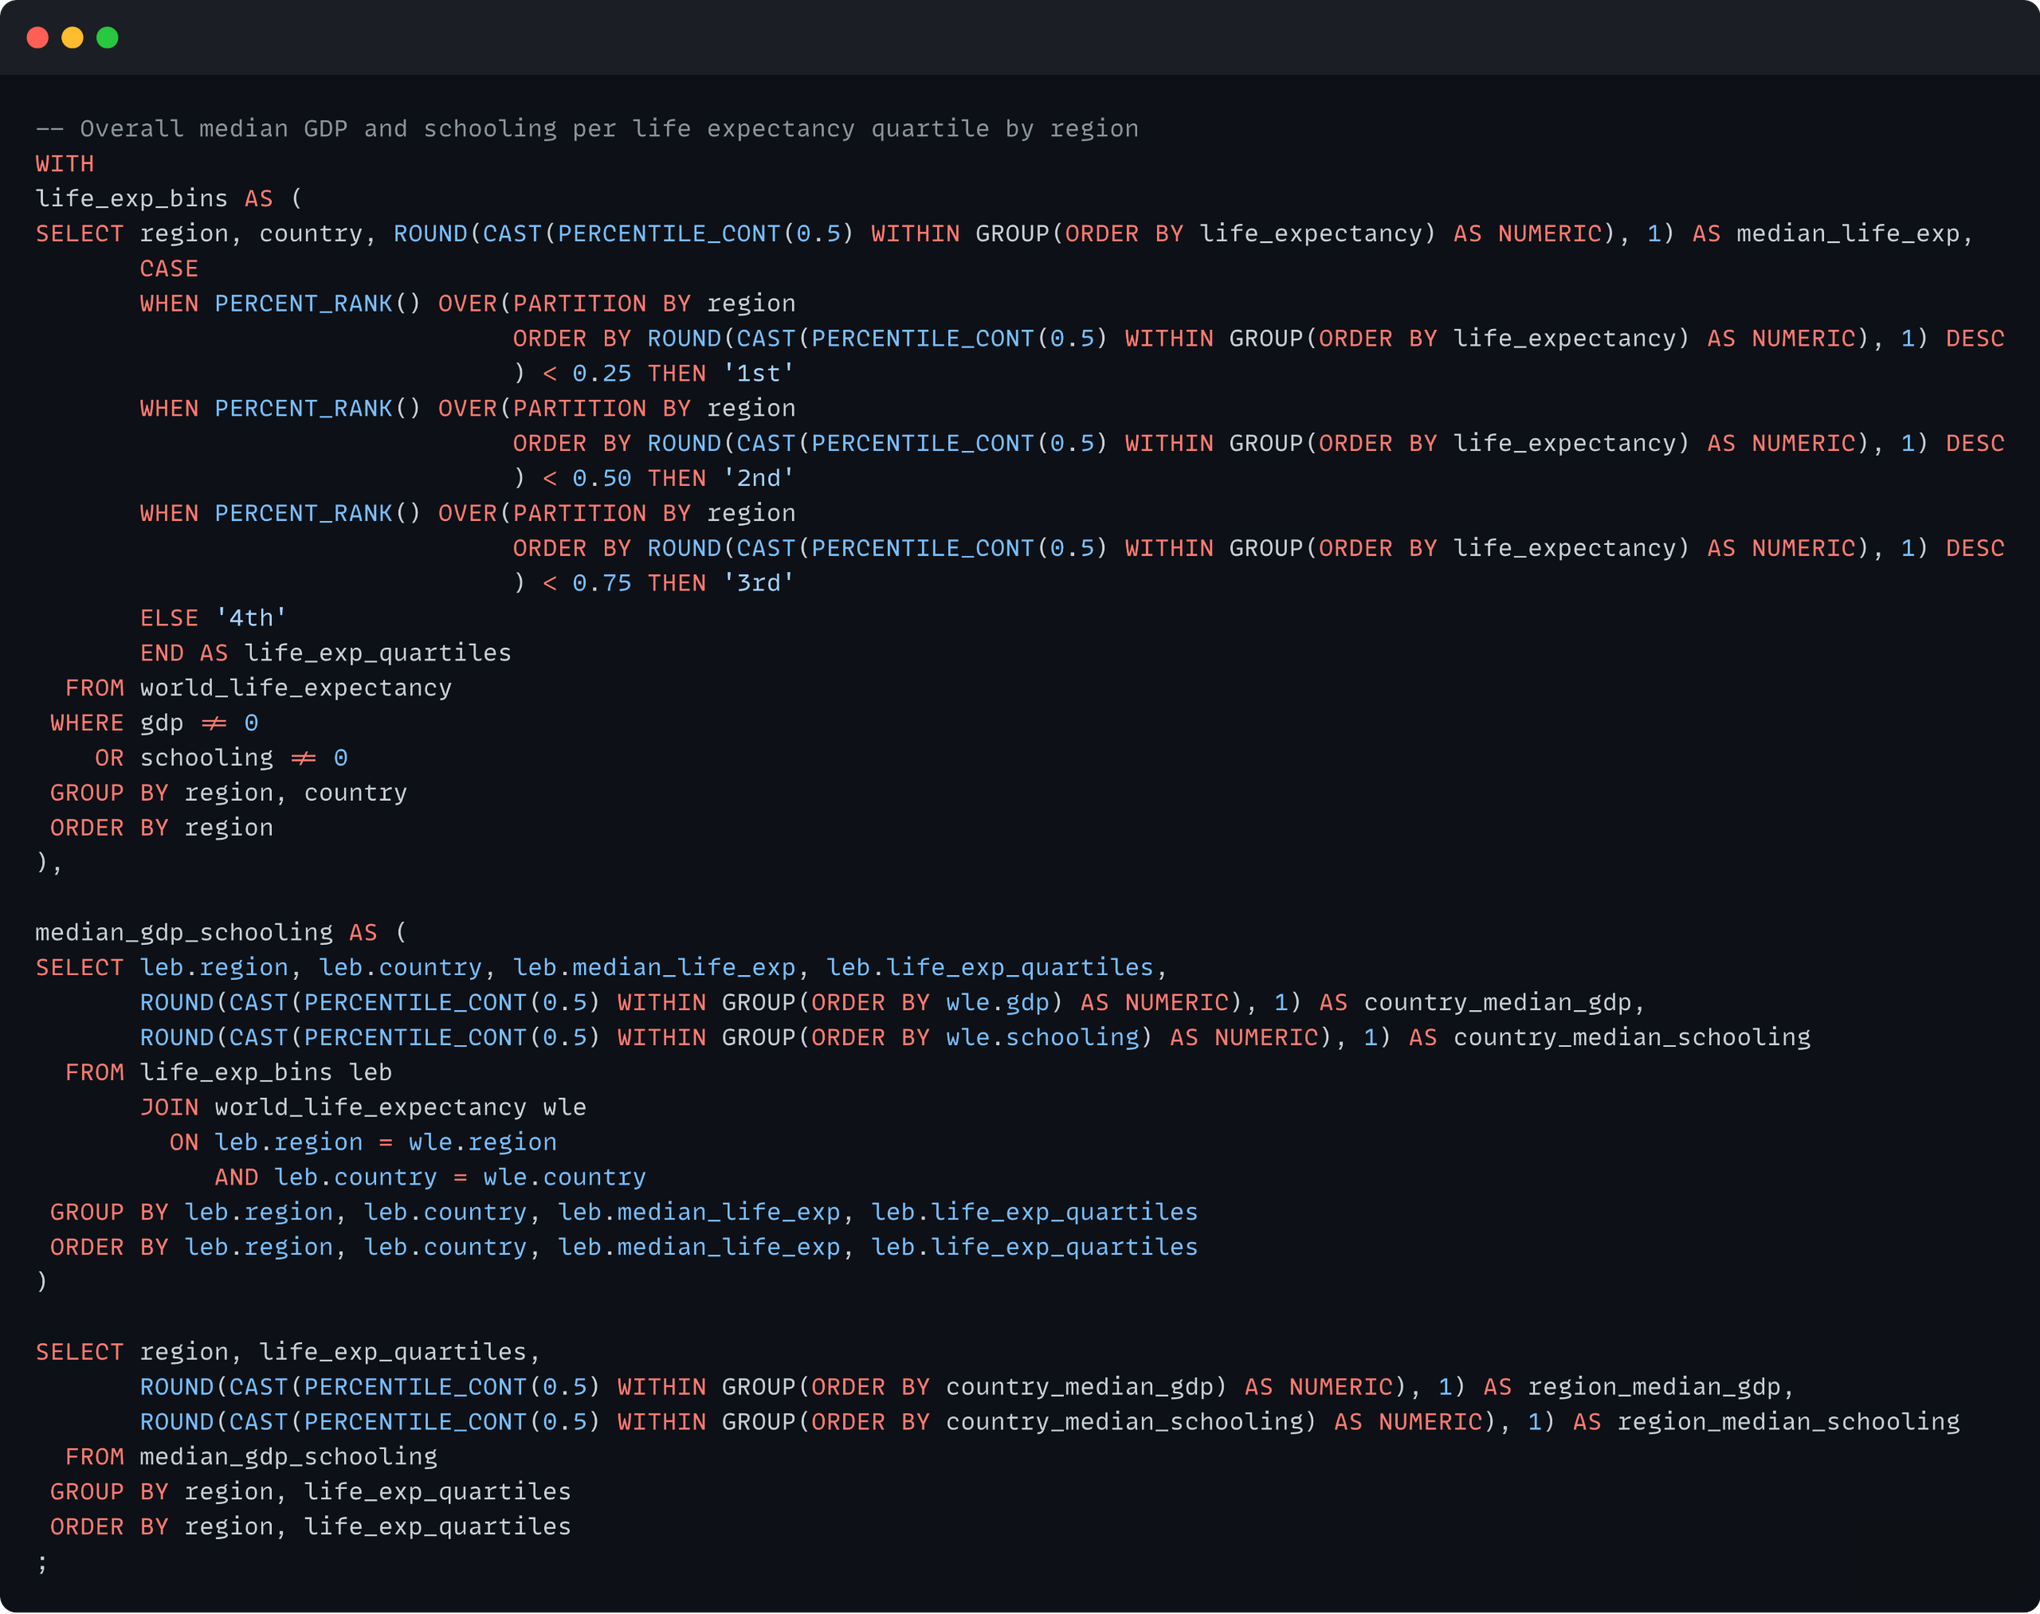
Then, I crunched the numbers to find the middle ground for life expectancy in each country – that's the median. It gives us a peek into the typical life expectancy in a place. Then, I sorted these values into four groups, or quartiles, based on how they stack up. It's like putting them into tiers, with 1 being the top tier and 4 the bottom one. This way, we can easily see the different levels of life expectancy across countries.After, I found the middle ground for GDP and schooling in each country. I sorted them based on both region and life expectancy quartile. This double sorting lets us really zoom in and see how GDP, schooling, and life expectancy play together in different regions.
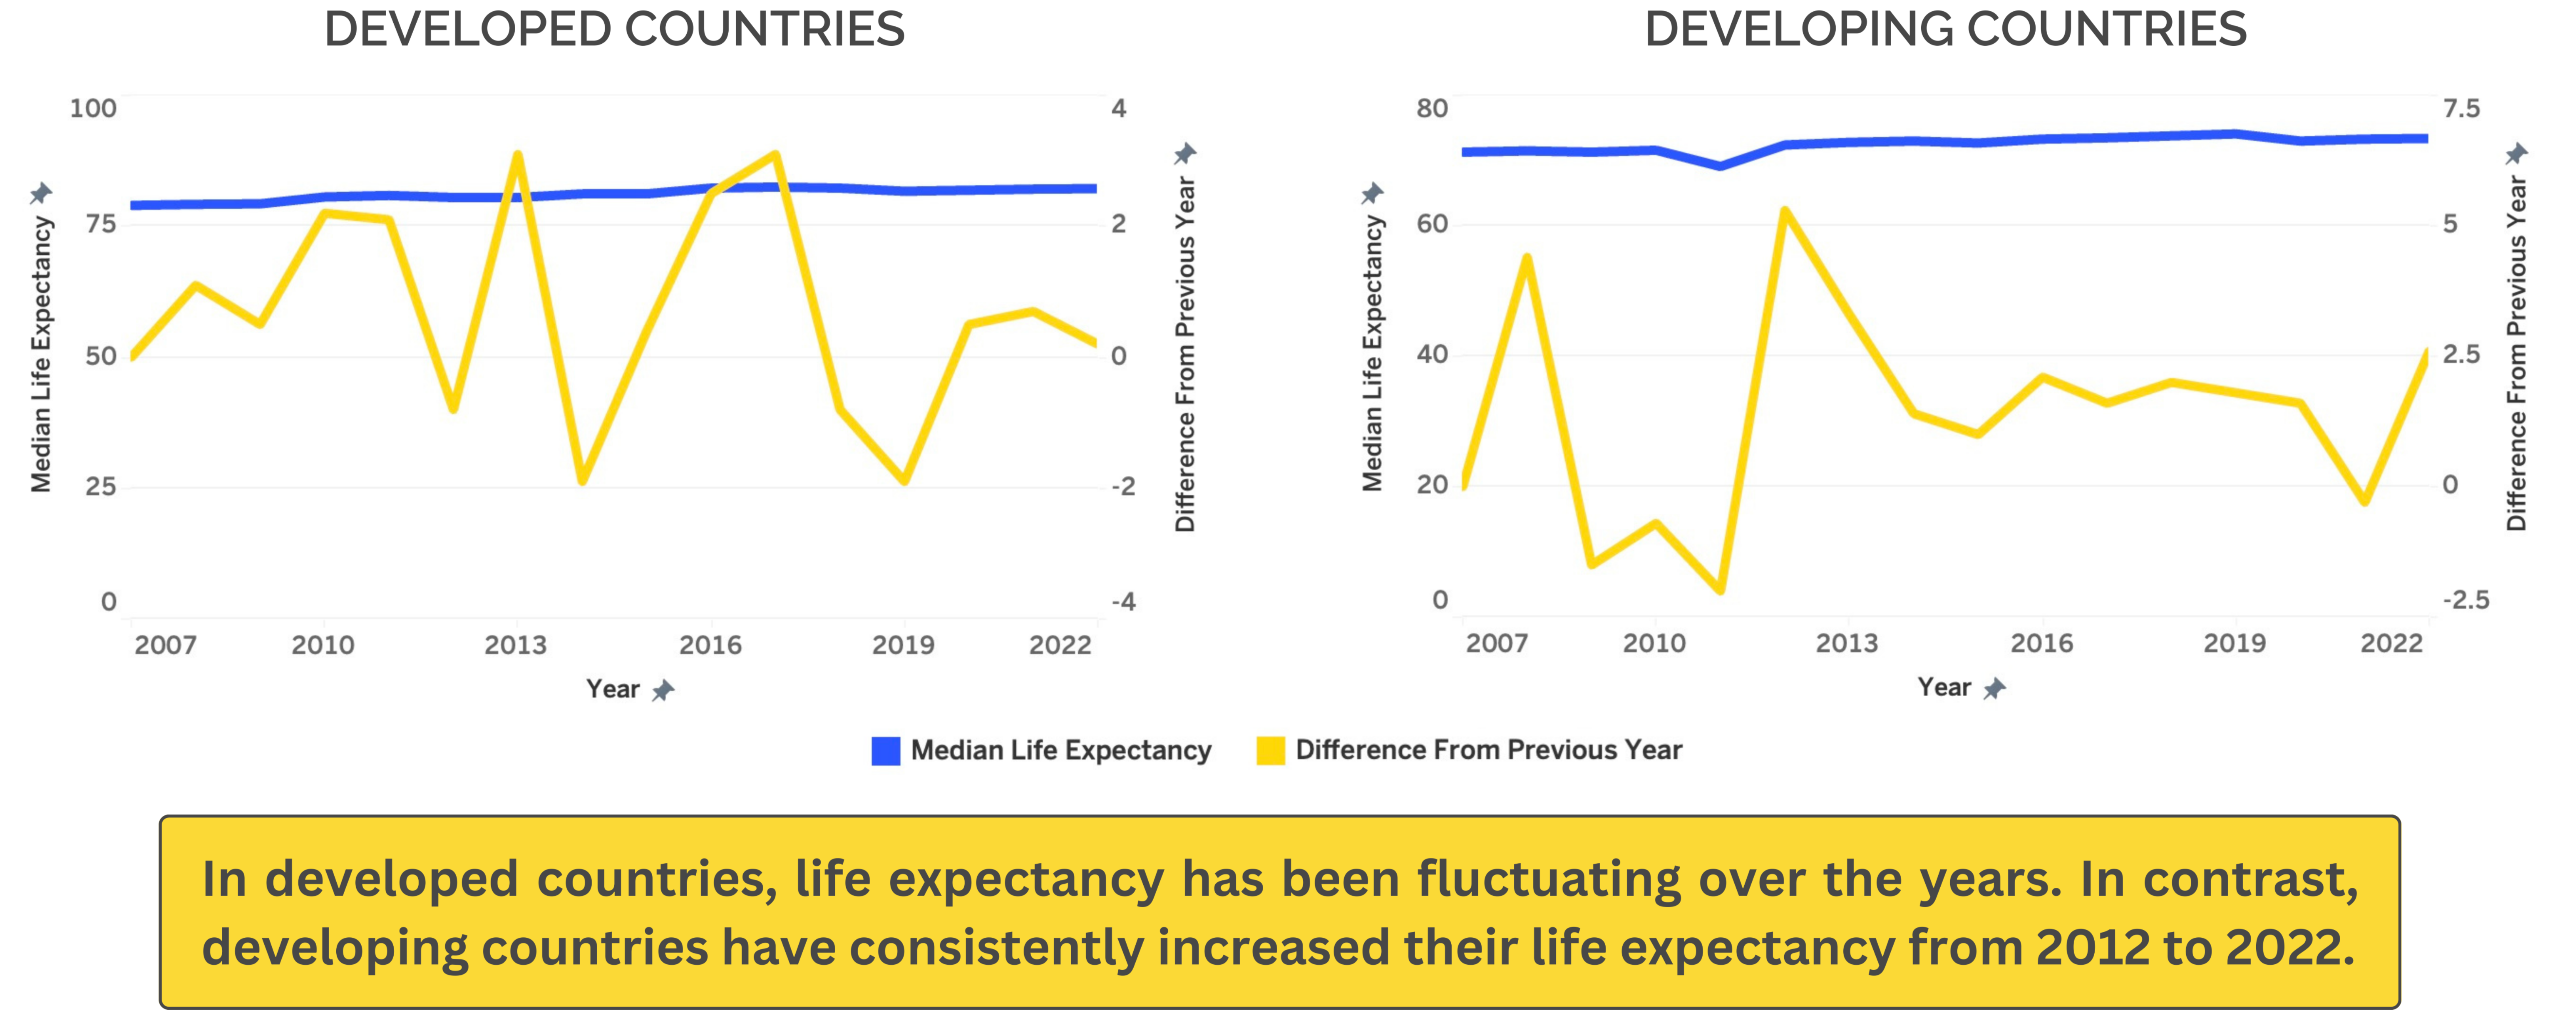
Then, to get a grip on how life expectancy varies between developed and developing countries, I made a line chart showing the yearly median life expectancy for both groups. It gives us the big picture of how things have been changing over time. But I didn't stop there, because I also threw in the difference from the previous year. This way, we can easily spot the ups and downs in typical life expectancy in different years—makes it way more interesting, right?
Results & Takeaways
Correlation with Socioeconomic Factors
Life expectancy is positively correlated with higher GDP and education levels in nations. This relationship can be attributed to the direct impact of elevated GDP on improved healthcare infrastructure and the positive association between higher education levels and enhanced health knowledge, awareness of preventive measures, and adoption of healthier lifestyle choices. These factors collectively contribute to an extended and healthier lifespan.
Disparities Across Development Levels
Historically, developed countries have consistently demonstrated higher life expectancies. This pattern is attributable to the well-established healthcare systems, accessibility to advanced medical technologies, and an overall higher standard of living prevalent in these nations. On the other hand, developing countries exhibit a noteworthy trajectory of growth over time. This growth often translates into advancements in infrastructure, healthcare facilities, and educational opportunities, ultimately fostering an environment conducive to increased life expectancy.
Fill the form. It's easy.
Ever played hide and seek with a form? Neither have I. It's just a form. Find it, fill it, forget it. Easy peasy, form-squeezy.